Protovis is a Javascript visualization library that allows you to easily create interactive data visualizations for the web. It provides a declarative language for mapping data to graphical elements like bars, pies, lines, etc.
Protovis: JavaScript Visualization Library for Interactive Data Visualizations
Protovis is a Javascript visualization library that allows you to easily create interactive data visualizations for the web. It provides a declarative language for mapping data to graphical elements like bars, pies, lines, etc.
What is Protovis?
Protovis is an open-source Javascript visualization library released in 2009. It provides a declarative syntax to create a variety of interactive graphical displays like bar charts, scatter plots, pie charts, trees, networks and more.
Some key features of Protovis include:
Simple declarative domain-specific language that allows you to bind data dynamically to graphical primitives
Animated transitions between different visualization states
Extensive range of scales for mapping data to visual properties
Built-in support for interactions like tooltips, zooming, selections etc.
Portability across browsers and devices
Free open-source library under BSD license
Protovis fills a useful niche between full-featured visualization platforms like D3js and simple libraries that generate just one type of plot. The declarative language makes it easy to learn and fast way to create standard or custom data visualization on the web pages.
Protovis Features
Features
Declarative language for creating custom visualizations
Built on top of SVG, Canvas and HTML for rendering
Animations and transitions for interactive graphics
Supports common charts like bar, pie, scatter, maps etc
Data binding for dynamically updating charts
Scales and axes for quantitative data
Supports canvas rendering for improved performance
Pricing
Open Source
Pros
Easy to learn and use
Very flexible for creating custom, interactive visualizations
Good performance even with large datasets
Integrates well with other Javascript libraries like D3.js
Cons
Limited documentation and examples
No longer actively maintained
Less support and community compared to newer libraries
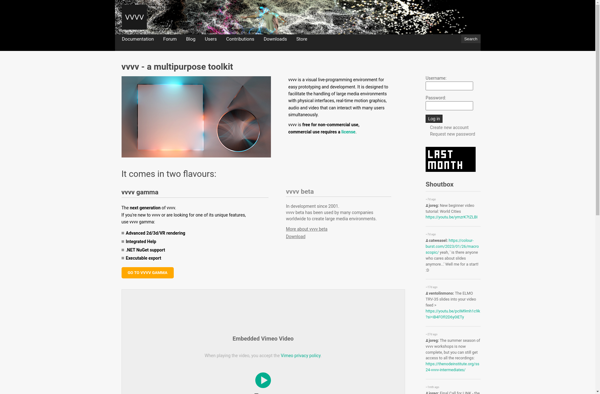
Vvvv is a flexible and versatile programming environment focused on real-time interactive media, installations, and performances. It uses a dataflow based visual programming language that allows users to connect modules for processing video, audio, graphics, and other types of data flows.Some key features of Vvvv include:Real-time video processing and effects3D...
Processing is an open-source computer programming language and integrated development environment (IDE) built for the electronic arts, new media art, and visual design communities with the purpose of teaching non-programmers the fundamentals of computer programming in a visual context.Processing uses a simplified syntax based on the Java language, but uses...
Cinder is an open-source block storage platform designed to provide persistent block storage for OpenStack cloud computing environments. As a core OpenStack project, Cinder integrates with OpenStack compute and networking services to provide expanded storage capabilities for virtual machines running in an OpenStack deployment.Some key capabilities and features of Cinder...
Processing.js is an open-source JavaScript port of the popular Processing visualization programming language and environment. It allows web browsers to display animations, visualizations, and interactions using the Processing syntax and graphical capabilities.Some key features of Processing.js include:Works with modern web browsers like Chrome, Firefox, and SafariSupports 2D and 3D graphics,...
NodeBox is an open-source application used to create generative design, data visualizations, animations and other 2D graphics using Python scripting. It allows designers, artists and programmers to quickly generate visual content through code rather than manual work.Some key features of NodeBox include:An intuitive node-based interface to create graphics by connecting...
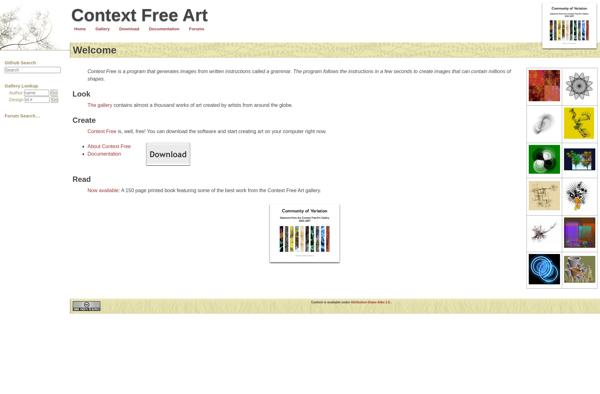
Context Free is a Windows and macOS application used to create recursive geometric images. It provides an accessible way for artists, designers, math enthusiasts, and programmers to create complex digital art based on geometric shapes and preset transformations.The program has an intuitive drag-and-drop interface that allows users to define rules...
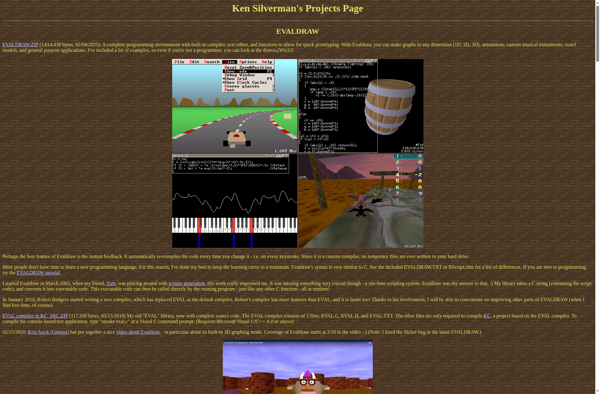
Evaldraw is an open-source, cross-platform computer graphics, image processing and visualization software. It provides tools for creating 2D and 3D graphics, analyzing and processing images, visualizing scientific data, developing graphical user interfaces and more.Some of the key features of Evaldraw include:Powerful 2D and 3D rendering engines for creating high-quality graphicsSupport...