AnyChart

AnyChart: Lightweight & Robust JavaScript Charting Library
Create interactive charts and dashboards with over 80 chart types and 1,000 customizable features for web and mobile applications.
What is AnyChart?
AnyChart is a feature-rich JavaScript charting library that enables developers to easily add interactive charts and dashboards to web and mobile applications. With its lightweight architecture, AnyChart aims to provide high performance chart rendering optimized even for large datasets.
AnyChart supports over 80 chart types including column, bar, line, area, pie, scatter, pert, radar, gauges, heat maps, treemaps and more. Developers can customize every aspect of charts from data to labels, tooltips, legend and titles. Advanced features include chart animation, drill-downs, crosshair and range selection.
AnyChartCharting library integrates with popular frameworks like React, Angular, Vue.js as well as backend platforms such as Node.js, PHP, .NET and Java. It also provides client-side Excel-compatible (XLSX) export and PDF conversion capabilities out of the box.
AnyChart provides solutions tailored charts for specific business use cases such as financial dashboards, sales analytics, healthcare analytics, weather data maps and more. It's used by leading companies such as Microsoft, Samsung, IBM, eBay and Oracle.
With its free commercial license, feature completeness and steady releases, AnyChart presents developers a robust enterprise-level charting solution to power data visualizations and dashboards for their applications and websites.
AnyChart Features
Features
- Over 80 chart types including line, area, bar, pie, scatter, stock, maps, heatmaps, gauges, etc
- Interactive and customizable dashboards
- Drill down and data filtering capabilities
- Robust API for advanced customization
- Works across devices and screen sizes
- Export charts as images and PDFs
- Animate charts and add interactivity
- Real-time and streaming data support
- Integrates with popular frameworks like React, Angular, Vue.js
- Can be embedded into web apps or work as a standalone library
Pricing
- Free
- Commercial License
Pros
Cons
Official Links
Reviews & Ratings
Login to ReviewThe Best AnyChart Alternatives
View all AnyChart alternatives with detailed comparison →
Top Data Visualization and Javascript Charting Library and other similar apps like AnyChart
Here are some alternatives to AnyChart:
Suggest an alternative ❐Think-cell chart

Google Charts

Plotly

Highcharts

CanvasJS Charts

SAP BusinessObjects

Aploris

Visuafy
Chart.js

Widestage

D3.js

C3.js

Open Flash Chart

NVD3

Bokeh

Amazon QuickSight

ZoomCharts

Chartist.js

ApexCharts

UpSlide

Peltier Tech Marimekko Chart Utility

Processing.js

Mekko Graphics

Charts 4 PHP

Grunt.pro

LiveGap Charts

Frappé Charts

Angoss KnowledgeSEEKER

Morris.js

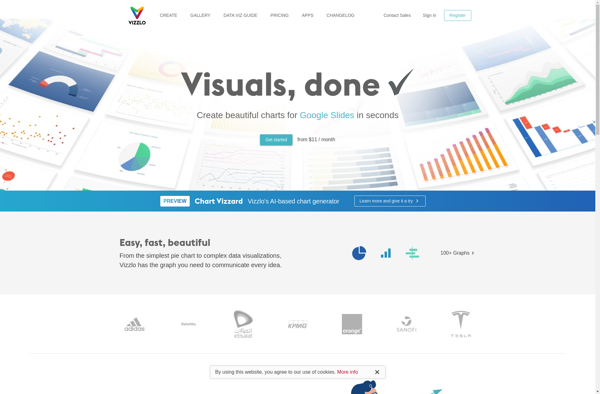
Vizzlo
InfoCaptor Dashboard

RAWGraphs

Epoch Charting Library

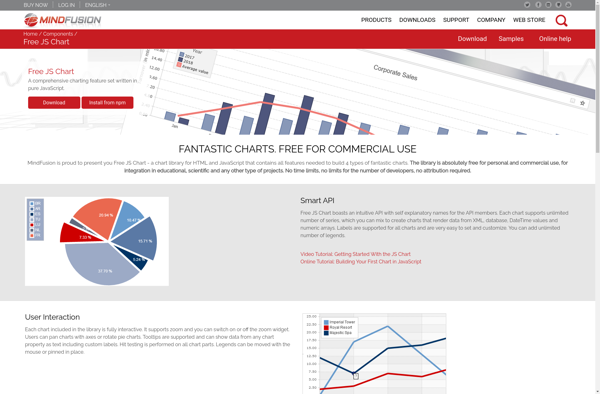
Free JS Chart
ArcadiaCharts
Create a chart online
Chart Templates

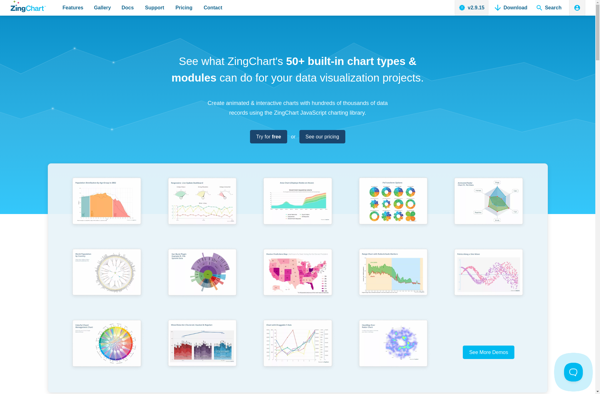
ZingChart
D3plus

PykCharts.js
CanvasXpress
