Vizzlo

Vizzlo

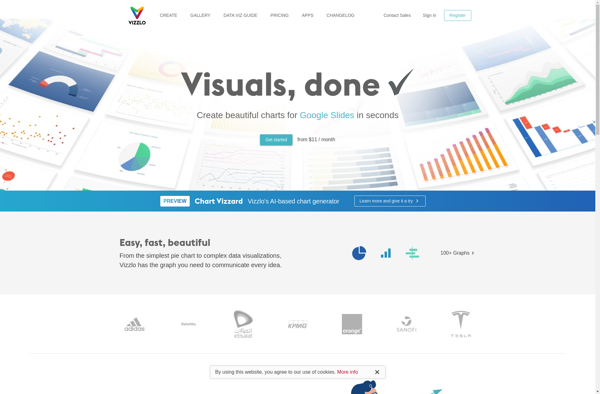
Vizzlo is a data visualization and infographic software that allows anyone to create stunning visuals, infographics and reports in minutes by simply dragging and dropping. It has a wide library of charts, maps, shapes and illustrations to choose from.
Vizzlo image
data-visualization infographics charts maps reports

Vizzlo: Drag-and-Drop Data Visualization Softwares

Create stunning visuals, infographics, and reports with Vizzlo's easy-to-use drag-and-drop interface and wide library of charts, maps, shapes, and illustrations.

What is Vizzlo?

Vizzlo is an easy-to-use data visualization and infographic software tool that empowers anyone, regardless of design experience, to create beautiful, professional data visualizations, infographics, presentations and reports in just minutes.

With an intuitive drag-and-drop interface and access to a massive library of charts, maps, shapes and illustrations, Vizzlo makes it simple for users to take data and turn it into visually compelling stories. Whether you need to create sales reports, infographics, dashboards, presentations or even flyers and social media posts, Vizzlo has you covered.

Key features include:

  • Drag-and-drop functionality for easily building visuals
  • Huge template library and image database
  • Animated and interactive data viz capabilities
  • Real-time collaboration for team editing
  • Dynamic linking between visuals
  • Auto-updating charts and graphs from spreadsheets
  • Exporting and sharing options for PNG, PDF, PPT and more

With affordable pricing plans for individuals, teams and enterprises, Vizzlo makes data visualization accessible for organizations of all sizes. Its user-friendly editor paired with powerful visualization features empowers anyone to translate data into insight with visual storytelling.

Vizzlo Features

Features

  1. Drag and drop interface
  2. Large library of charts, maps, shapes and illustrations
  3. Animated transitions between slides
  4. Real-time collaboration
  5. Integrates with Excel, Google Sheets and other data sources
  6. Export as image, PDF, PPT or embed in websites

Pricing

  • Freemium
  • Subscription-Based

Pros

Intuitive and easy to use

Great for creating visually appealing presentations

Collaboration features make it good for teams

Many customization options for visuals

Cons

Can be pricey for some individuals or small teams

Limited free version

Not as advanced as some data visualization tools


The Best Vizzlo Alternatives

Top Ai Tools & Services and Data Visualization and other similar apps like Vizzlo


Tableau icon

Tableau

Tableau is a leading business intelligence and data visualization platform used by organizations of all sizes to transform their data into easy-to-understand visualizations and dashboards. With Tableau, users can connect to a wide range of data sources, prepare and clean the data for analysis, and create interactive data visualizations such...
Tableau image
Think-cell chart icon

Think-cell chart

think-cell is a software suite designed to simplify the creation of professional-looking charts and presentations, particularly within the Microsoft Office environment. It is known for its integration with Microsoft PowerPoint and Excel, providing tools to streamline the design and formatting of complex charts and visual elements. Key Features: Chart Creation:...
Think-cell chart image
Plotly icon

Plotly

Plotly is an open-source graphing library that allows users to create interactive, publication-quality graphs, charts, and dashboards. It supports Python, R, JavaScript, and Excel as programming languages. Some key features of Plotly include:Interactive visualization - Plotly charts are interactive with features like hover text, zooming, panning, selectable legends, and editable...
Plotly image
Highcharts icon

Highcharts

Highcharts is an advanced JavaScript charting library used to visualize data and create interactive charts and graphs in web applications. Originally developed in 2009 by Highsoft AS, Highcharts allows developers to quickly add charts and graphs to their web pages with support for a wide variety of chart types out...
Highcharts image
Datamatic.io icon

Datamatic.io

Datamatic.io is a cloud-based no-code data pipeline platform that allows users to build data integration, transformation, and loading processes without needing to write any code. Some key features of Datamatic.io include:Graphical interface to visually design data pipelines by connecting various pre-built data source and destination connectors as well as transformation...
Datamatic.io image
Visuafy icon

Visuafy

Visuafy is a powerful yet user-friendly data visualization and dashboarding platform used by companies and organizations to gain meaningful insights from their data. It allows users without coding skills to create customized, interactive data visualizations including charts, graphs, gauges, maps, and more.Key features of Visuafy include:Drag-and-drop interface to easily build...
AmCharts icon

AmCharts

amCharts is a feature-rich JavaScript charting library that enables you to create interactive charts, dashboards, and data visualizations. With amCharts, you can build solutions for both web and mobile platforms.Some key capabilities and benefits of amCharts include:Supports a wide variety of chart types: line, column, bar, pie, radar, scatter, gauges,...
AmCharts image
Venngage icon

Venngage

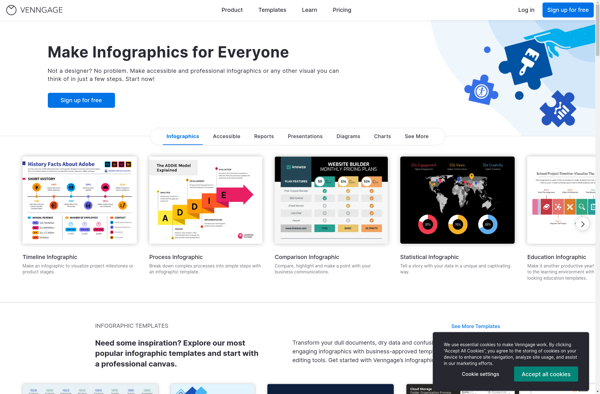
Venngage is a leading visual content creation platform used by individuals and teams to create impactful infographics, presentations, flyers, reports and other visual content. It provides an easy-to-use online editor that allows users to visually create professional graphics and documents in just a few clicks.With Venngage's drag-and-drop interface, users can...
Venngage image
Piktochart icon

Piktochart

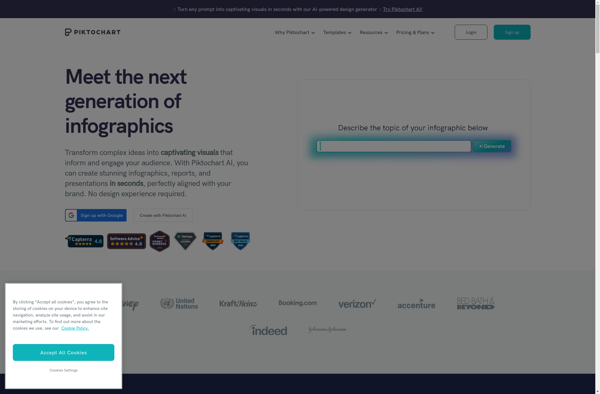
Piktochart is a web-based graphic design application that makes it simple for non-designers to create professional-looking visual content. Some key features of Piktochart include:Drag-and-drop interface - Easy to use even for those with no design experienceHundreds of templates - Choose from infographics, posters, presentations, social media graphics, and moreIcons, images,...
Piktochart image
Infogr.am icon

Infogr.am

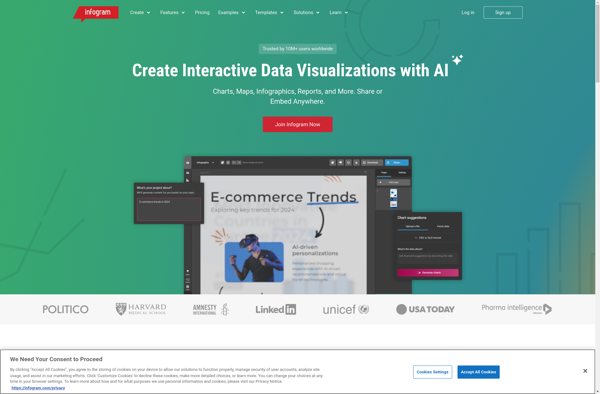
Infogr.am is a user-friendly infographic and data visualization creation software. With an easy drag-and-drop interface, it enables anyone to create sleek, interactive infographics, charts, maps and dashboards in just minutes without coding.Some key features of Infogr.am:Large library of charts and graphs (bar, pie, line, area, scatterplots etc.) to visualize dataInteractive...
Infogr.am image
Grunt.pro icon

Grunt.pro

Grunt.pro is a popular open-source JavaScript task runner used by web developers to automate repetitive tasks in their workflow. Some key features and benefits of Grunt.pro include:Automation of common development tasks like minification, compilation, linting, unit testing etc.Helps improve productivity by eliminating manual repetition of coding tasksEasy to integrate into...
Grunt.pro image
Marple icon

Marple

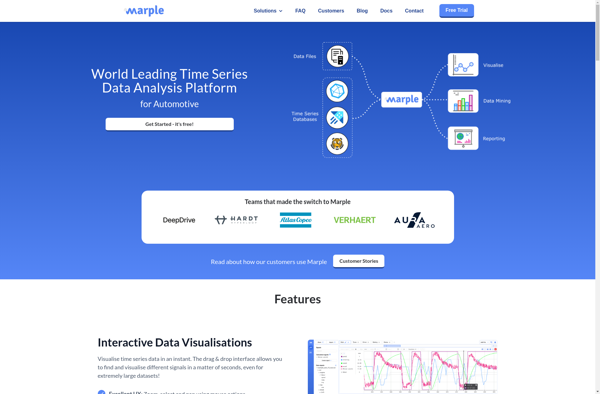
Marple is an open-source, Markdown-based slide deck tool for creating presentations. It provides a minimalistic editor interface to write slide content in Markdown format, which then gets rendered into an elegant slide deck for presenting.Some key features of Marple:Write slide content in easy-to-read and write Markdown format. Format headings, lists,...
Marple image
Create a chart online icon

Create a chart online

ChartGo is an intuitive yet powerful online chart maker and graph maker, allowing anyone to easily create professional-looking charts and graphs without any prior experience.With ChartGo, you can quickly visualize your data by choosing one of many chart types including bar charts, pie charts, line graphs, scatter plots, area charts,...
AnyChart icon

AnyChart

AnyChart is a feature-rich JavaScript charting library that enables developers to easily add interactive charts and dashboards to web and mobile applications. With its lightweight architecture, AnyChart aims to provide high performance chart rendering optimized even for large datasets.AnyChart supports over 80 chart types including column, bar, line, area, pie,...
AnyChart image