Create a chart online
Create beautiful charts and graphs online with ChartGo
Easy to use chart maker that requires no account setup. Make bar, pie, line, scatter plots and more. Export charts as images or pdf.
What is Create a chart online?
ChartGo is an intuitive yet powerful online chart maker and graph maker, allowing anyone to easily create professional-looking charts and graphs without any prior experience.
With ChartGo, you can quickly visualize your data by choosing one of many chart types including bar charts, pie charts, line graphs, scatter plots, area charts, histograms, heat maps, and more. Whether you need to make a flowchart, org chart, concept map, or just a basic chart or graph - ChartGo makes it simple.
Some key features include:
- No account required - start creating charts instantly
- Easily customize every element of your chart
- Dynamically change your data to create multiple chart variations
- Export charts as image files or PDF documents
- Collaborate with others by sharing a ChartGo URL
- 100% free to use (no pro accounts)
If you need to visualize data, ideas, or processes, ChartGo eliminates the learning curve with an intuitive click-and-drag user interface that just makes sense. The simple yet flexible tools provide endless possibilities for infographics, reports, presentations, analysis, strategy visualizations, and more.
Create a chart online Features
Features
- Easy to use chart creator
- No account setup required
- Supports various chart types (bar, pie, line, scatter, etc.)
- Export charts as images or PDFs
- Customizable chart styling and formatting
Pricing
- Free
Pros
Cons
Official Links
Reviews & Ratings
Login to ReviewThe Best Create a chart online Alternatives
View all Create a chart online alternatives with detailed comparison →
Top Office & Productivity and Data Visualization and other similar apps like Create a chart online
Here are some alternatives to Create a chart online:
Suggest an alternative ❐Plotly

Highcharts

CanvasJS Charts

ChartBlocks

AmCharts

ZoomCharts

Koia

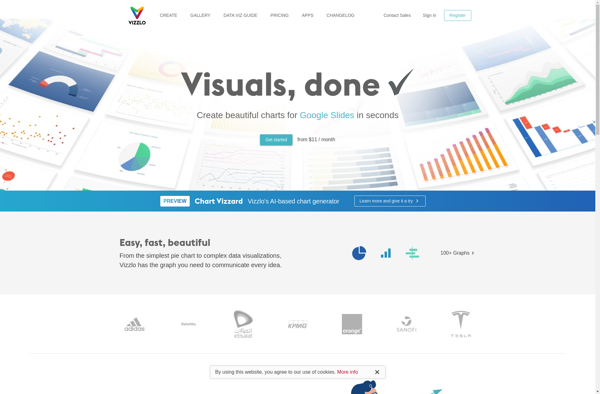
Vizzlo
AnyChart
