Koia is an open-source alternative to Canva for creating graphics, presentations, posters, infographics, and other visual content. It provides a user-friendly editor with drag-and-drop functionality to easily customize designs.
Create professional-grade graphics, presentations, and visual content with Koia, an open-source editor offering drag-and-drop functionality for easy customization.
What is Koia?
Koia is an open-source, self-hosted alternative to Canva's web-based graphic design platform. Like Canva, Koia provides an intuitive drag-and-drop interface and a wide range of templates and design assets to help users with no design experience easily create stunning graphics, presentations, posters, brochures, resumes, invitations and more for business, education, social media, blogs and personal use.
Key features of Koia include:
Hundreds of professional templates for posters, logos, resumes, invitations, infographics, flyers, book covers, social media posts and more
Drag-and-drop editor for easily customizing templates by adding, deleting, replacing or moving elements around
Photo editor with cropping, filters, text overlay and drawing tools
Library of over 2 million premium royalty-free stock photos, illustrations and graphics
Supports uploading your own images and fonts for total customizability
Real-time collaboration allows multiple users to co-edit designs
Version history to track changes and easily revert back
Media manager helps organize all your Koia design files in one place
Share designs via export or generate shareable links
Completely free and open-source (MIT license)
By self-hosting Koia, you retain complete ownership and control over your data while still leveraging a powerful graphic design platform comparable to Canva or Adobe Express. The open-source model also allows customizations tailored to your specific needs.
Koia Features
Features
Drag-and-drop interface
Templates for social media posts, presentations, posters, resumes, etc
Photo editor with filters, cropping, resizing, etc
Ability to create custom color palettes
Supports multiple file formats like PNG, JPG, PDF, etc
Collaboration tools to work on designs with others
Pricing
Open Source
Pros
Free and open source
Intuitive and easy to use
Good selection of templates
Active development community
Cross-platform - works on Windows, Mac, Linux
Cons
Limited features compared to paid options like Canva
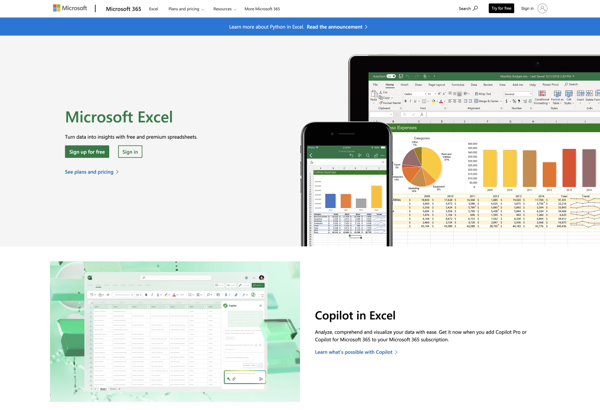
Microsoft Excel stands as the quintessential spreadsheet software, offering unparalleled versatility and functionality for individuals and businesses alike. A cornerstone of the Microsoft Office suite, Excel empowers users to organize, analyze, and interpret data efficiently. Its grid of cells allows for the creation of complex calculations, making it an indispensable...
LibreOffice Calc is the spreadsheet component of the LibreOffice suite, offering users a robust, open-source alternative for managing and analyzing data. As part of the free and open-source software movement, LibreOffice Calc provides a cost-effective and feature-rich solution for individuals, businesses, and organizations looking to break away from proprietary spreadsheet...
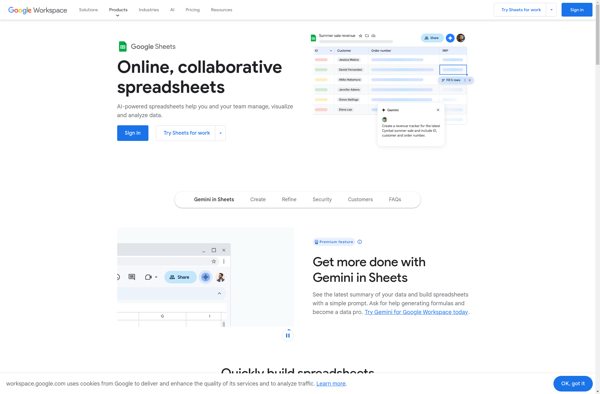
Google Sheets is a spreadsheet program developed by Google as part of its free, web-based Google Workspace productivity suite. It features the ability to create, view, edit and collaborate on spreadsheets online in real time. Key features of Google Sheets include:Create and edit spreadsheets with cells for different types of...
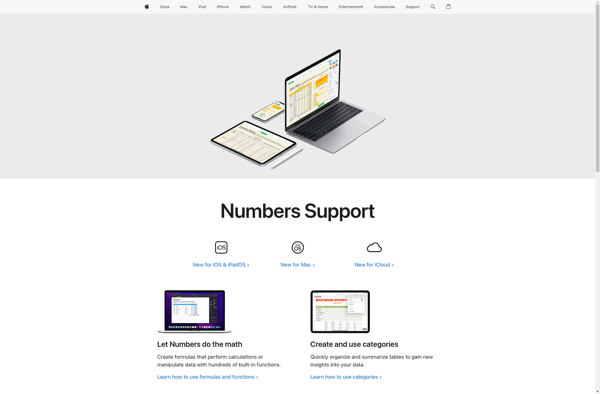
Numbers is a spreadsheet application developed by Apple Inc. as part of its iWork productivity suite, along with Keynote and Pages. Numbers is available for both macOS and iOS operating systems.Numbers features an intuitive interface and offers tools for creating visually compelling spreadsheets. Key capabilities include:Customizable tables and chartsOver 250...
Plotly is an open-source graphing library that allows users to create interactive, publication-quality graphs, charts, and dashboards. It supports Python, R, JavaScript, and Excel as programming languages. Some key features of Plotly include:Interactive visualization - Plotly charts are interactive with features like hover text, zooming, panning, selectable legends, and editable...
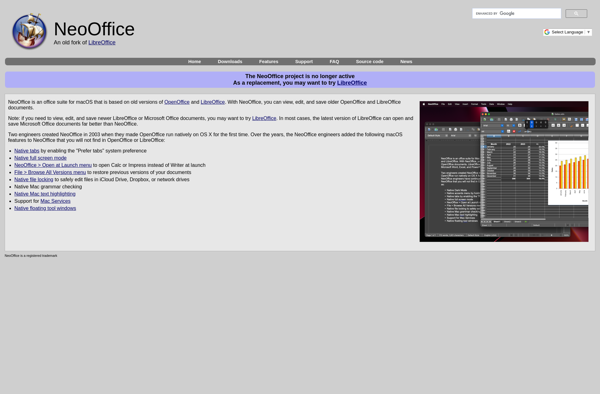
NeoOffice is an open source and free office suite for macOS that delivers features similar to Microsoft Office. Originally based on OpenOffice, NeoOffice uses the same open standards and file formats, making it easy to open and edit Microsoft Office documents in Word, Excel, and PowerPoint.The word processor in NeoOffice,...
Gnumeric is an free, open source spreadsheet program created to be a lightweight alternative to software like Microsoft Excel. It is designed to provide many of the common features found in Excel while using less system resources and without expensive licensing fees.Some key features of Gnumeric include:Support for a wide...
D3.js, or D3, is an open-source JavaScript library used for visualizing data with web standards. D3 stands for Data-Driven Documents. It allows developers to bind arbitrary data to the Document Object Model (DOM) and then apply data-driven transformations to the document. This allows web developers to create dynamic, interactive data...
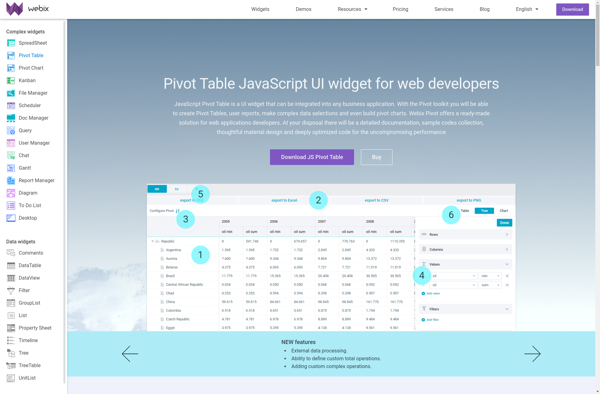
Webix Pivot Table is a feature-rich JavaScript pivot table component for web applications. It allows you to explore, analyze and visualize multidimensional data interactively. Some key features include:Drag-and-drop interface for pivot table buildingDrill down/up, slice and dice dataCalculated fields and filtering optionsExport pivot tables to PDF, Excel etc.Responsively designed and...
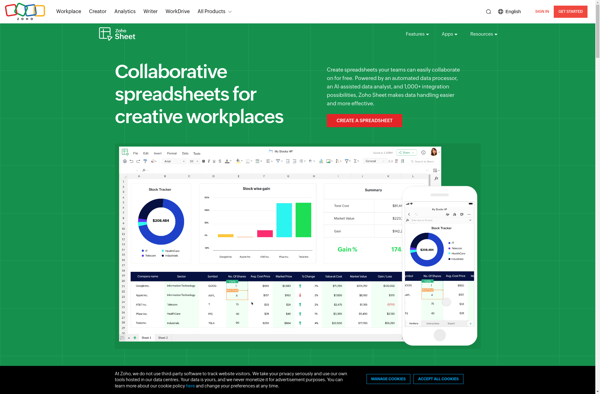
Zoho Sheet is an online spreadsheet software application developed by Zoho Corporation. It is part of the Zoho Office Suite which includes other office productivity tools like a word processor, presentation software, and more.As an online spreadsheet software, Zoho Sheet provides core spreadsheet functionality like calculations, pivot tables, charts, and...
Apache OpenOffice Calc is a free, open source spreadsheet application that is part of the Apache OpenOffice software suite. It includes features similar to commercial spreadsheet programs like Microsoft Excel.Some key features and capabilities of Apache OpenOffice Calc include:Perform calculations and analyze data using formulas and functionsGenerate 2D and 3D...
RAWGraphs is a free, open-source web tool created for anyone to easily visualize and share data using the most common graphical formats. The simple drag and drop interface makes it easy for non-experts to quickly generate a wide variety of charts and diagrams that can be exported and shared as...
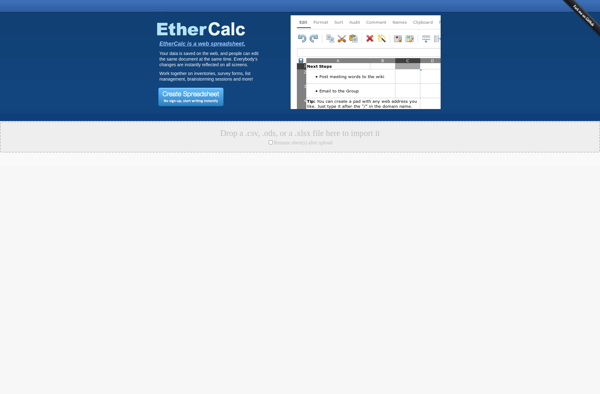
EtherCalc is an open-source web-based spreadsheet application that allows multiple users to collaboratively edit spreadsheets in real-time. It works right in the browser without needing any downloads or installations.Some key features of EtherCalc include:Real-time collaboration - Multiple users can edit the same spreadsheet simultaneously and see each other's changes instantlyOpen...
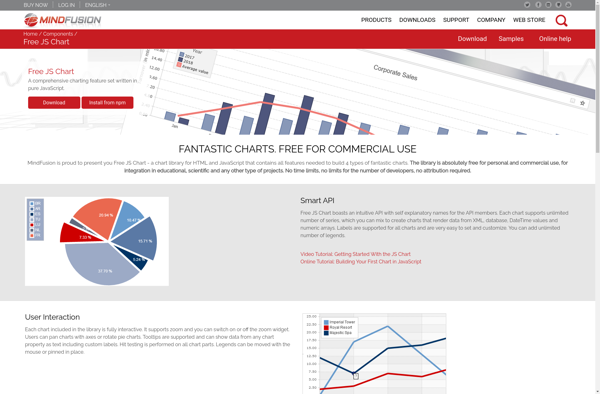
Free JS Chart is an open source JavaScript charting library that allows you to easily create different types of interactive charts and graphs using JavaScript and HTML5 Canvas element. It is completely free to use and customize as per your requirements.Some key features of Free JS Chart:Supports various chart types...
Chartico is a cloud-based data visualization and business intelligence software that allows users to easily create interactive charts, dashboards and reports from their data. Some key features of Chartico include:Drag-and-drop interface to build charts, dashboards and reports visually without codingConnect to data from SQL, MongoDB, Excel, CSVs and other sources...
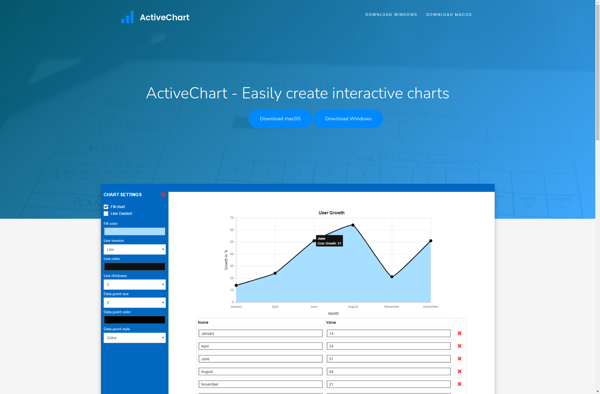
ActiveChart is a feature-rich JavaScript charting library for adding interactive data visualizations to web apps and sites. It lets developers easily create dynamic charts and graphs that respond to user input and data changes.Some key features of ActiveChart include:Support for different chart types like line, bar, pie, donut, area, scatter,...
ChartGo is an intuitive yet powerful online chart maker and graph maker, allowing anyone to easily create professional-looking charts and graphs without any prior experience.With ChartGo, you can quickly visualize your data by choosing one of many chart types including bar charts, pie charts, line graphs, scatter plots, area charts,...
Chart Templates is charting software that provides a library of pre-designed chart and graph templates that can be customized to visualize data. It helps non-designers easily create professional, on-brand data visualizations for business uses.The software includes hundreds of templates for all types of charts - from basic bar, lines and...
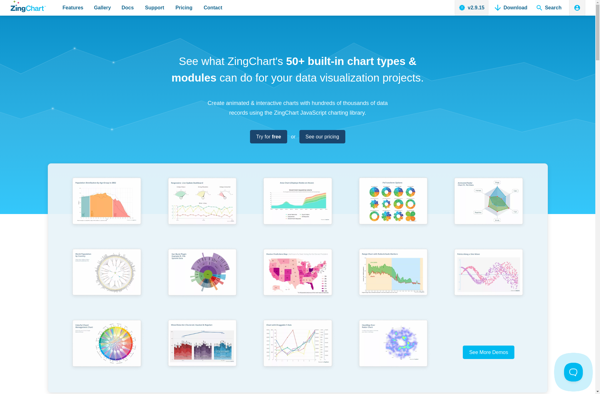
ZingChart is a feature-rich JavaScript charting library used to build interactive and animated data visualizations. It offers over 30 customizable chart types including line, column, bar, pie, scatter plots, heatmaps and more. With the ability to completely style and brand charts using CSS and theme builders, ZingChart provides the flexibility...
D3plus is an open-source JavaScript library that builds on top of D3.js to facilitate the creation of rich, interactive data visualizations and dashboards with minimal code. It was developed to extend the low-level functionality of D3 with higher-level abstractions, intuitive APIs, reusable components and templates to enable faster and easier...