D3plus

D3plus

D3plus is a JavaScript library that extends the functionality of D3.js to enable fast and easy data visualizations and dashboards. It provides reusable components, templates, animations, and interactivity with only a few lines of code. D3plus simplifies complex visualizations for
D3plus image
javascript d3js data-visualization dashboards charts

D3plus: Fast & Easy Data Visualizations

A JavaScript library extending D3.js for fast and easy data visualizations and dashboards, with reusable components, templates, animations, and interactivity

What is D3plus?

D3plus is an open-source JavaScript library that builds on top of D3.js to facilitate the creation of rich, interactive data visualizations and dashboards with minimal code. It was developed to extend the low-level functionality of D3 with higher-level abstractions, intuitive APIs, reusable components and templates to enable faster and easier development.

Some key features of D3plus include:

  • Reusable and customizable visualization components like bar charts, line plots, scatter plots, maps, etc.
  • Animated transitions and interactions like zooming, tooltips, etc.
  • Responsive layouts that automatically adapt across screen sizes
  • Theming and style customization through simple configuration
  • Built-in support for fetching/parsing/processing data
  • Simplified APIs that reduce complex D3 code down to just a few lines
  • Works nicely with popular frameworks like React, Angular, Ember, Vue, etc.

D3plus makes it possible to create production-ready visualizations with a minimal amount of code. It abstracts away D3 complexities so that even developers with little D3 experience can build advanced charts and dashboards. The extensive examples and documentation also help accelerate development.

D3plus Features

Features

  1. Reusable chart components
  2. Chart templates
  3. Animated transitions
  4. Tooltips and legends
  5. Zooming and panning
  6. Color schemes
  7. Responsive layouts

Pricing

  • Open Source

Pros

Simplifies D3.js

Fast and easy to create visualizations

Minimal code required

Good documentation

Active development

Cons

Less flexibility than pure D3.js

Steep learning curve for advanced usage

Limited chart types compared to other libraries


The Best D3plus Alternatives

Top Development and Data Visualization and other similar apps like D3plus


Plotly icon

Plotly

Plotly is an open-source graphing library that allows users to create interactive, publication-quality graphs, charts, and dashboards. It supports Python, R, JavaScript, and Excel as programming languages. Some key features of Plotly include:Interactive visualization - Plotly charts are interactive with features like hover text, zooming, panning, selectable legends, and editable...
Plotly image
CanvasJS Charts icon

CanvasJS Charts

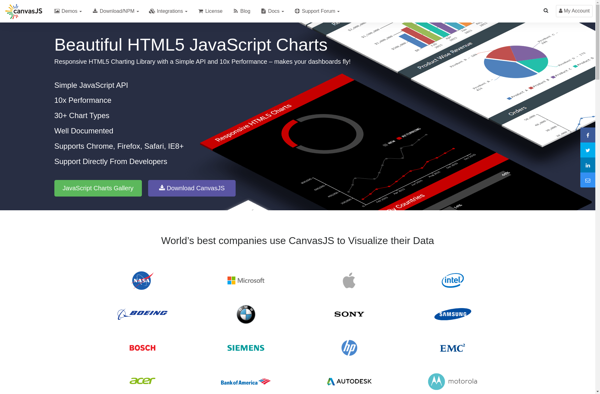
CanvasJS Charts is a feature-rich JavaScript HTML5 charting library that enables interactive charts, graphs and data visualizations in web applications and sites. It is free for non-commercial use and offers over 30 different chart types including line, area, column, bar, pie, doughnut, funnel, polar, radar, range and more.Some key features...
CanvasJS Charts image
D3.js icon

D3.js

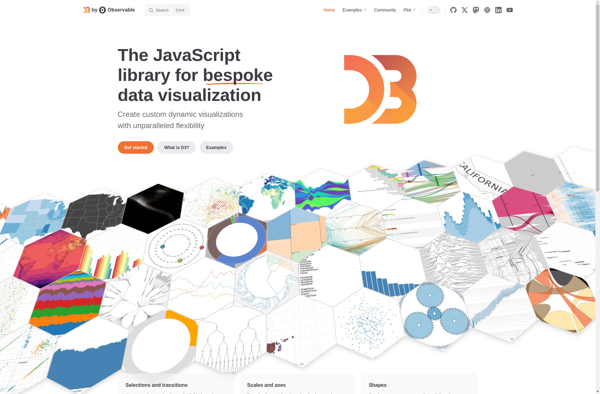
D3.js, or D3, is an open-source JavaScript library used for visualizing data with web standards. D3 stands for Data-Driven Documents. It allows developers to bind arbitrary data to the Document Object Model (DOM) and then apply data-driven transformations to the document. This allows web developers to create dynamic, interactive data...
D3.js image
ZoomCharts icon

ZoomCharts

ZoomCharts is a feature-rich JavaScript charting library used to create interactive data visualizations for web applications and dashboards. With over 90 chart types to choose from, including line, bar, pie, map, scatter, and more, ZoomCharts provides the flexibility to represent data in a meaningful way.Some of the key capabilities and...
ZoomCharts image
Koia icon

Koia

Koia is an open-source, self-hosted alternative to Canva's web-based graphic design platform. Like Canva, Koia provides an intuitive drag-and-drop interface and a wide range of templates and design assets to help users with no design experience easily create stunning graphics, presentations, posters, brochures, resumes, invitations and more for business, education,...
Koia image
AnyChart icon

AnyChart

AnyChart is a feature-rich JavaScript charting library that enables developers to easily add interactive charts and dashboards to web and mobile applications. With its lightweight architecture, AnyChart aims to provide high performance chart rendering optimized even for large datasets.AnyChart supports over 80 chart types including column, bar, line, area, pie,...
AnyChart image