CanvasJS Charts

CanvasJS Charts: Interactive Charting Library for Web Applications
CanvasJS Charts is a JavaScript charting library that enables interactive charts, graphs and data visualizations in web applications. It offers 30+ chart types including line, area, column, bar, pie, doughnut, funnel, polar charts and more.
What is CanvasJS Charts?
CanvasJS Charts is a feature-rich JavaScript HTML5 charting library that enables interactive charts, graphs and data visualizations in web applications and sites. It is free for non-commercial use and offers over 30 different chart types including line, area, column, bar, pie, doughnut, funnel, polar, radar, range and more.
Some key features of CanvasJS Charts:
- Interactive and animated charts
- Touch-friendly and responsive design
- Supports huge data sets with optimized performance
- Plenty of customization options
- Browser compatibility across devices and platforms
- Easy integration using simple APIs
- Hooks for drill-downs, click events, tooltips, etc.
- Auto updates when underlying data changes
- Renders both Canvas (HTML5) and SVG based charts
- Legends, axis labels, titles, etc.
CanvasJS Charts makes charting easy for web developers by abstracting away complexities of HTML5 Canvas and SVG. With its wide range of chart types, customizable features and optimized performance, CanvasJS is a great choice for interactive data visualizations in websites and web applications.
CanvasJS Charts Features
Features
- 30+ chart types including line, area, column, bar, pie, doughnut, funnel, polar charts
- Interactive data visualization
- Animations, zooming, panning
- Touch support for mobile devices
- Canvas rendering for better performance
- Export charts as images
- Drill down charts
- Real-time charts with streaming data
Pricing
- Open Source
Pros
Cons
Official Links
Reviews & Ratings
Login to ReviewThe Best CanvasJS Charts Alternatives
View all CanvasJS Charts alternatives with detailed comparison →
Top Development and Data Visualization and other similar apps like CanvasJS Charts
Here are some alternatives to CanvasJS Charts:
Suggest an alternative ❐Highcharts

Chart.js

ChartBlocks

AmCharts

C3.js

Open Flash Chart

NVD3

Dc.js

Bokeh

ZoomCharts

ApexCharts

Picasso.js

Vis.js

Charts 4 PHP

LiveGap Charts

Smoothie Charts

RGraph

UvCharts

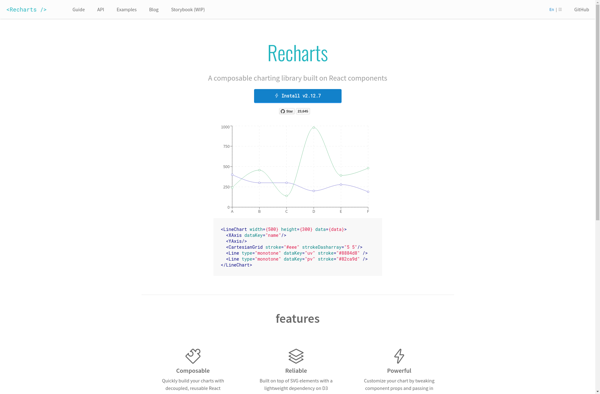
Recharts
Chartkick

JqPlot

Epoch Charting Library

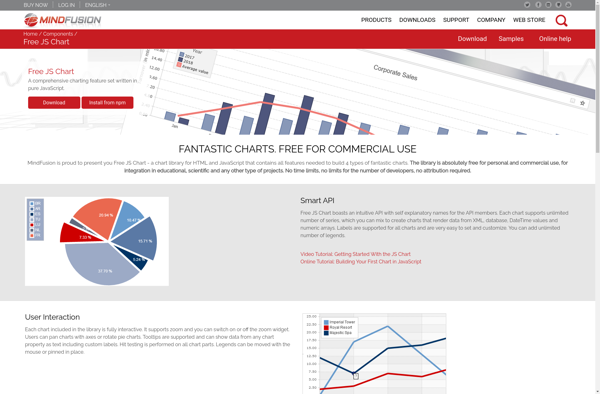
Free JS Chart
Ember Charts

ArcadiaCharts
Ggvis

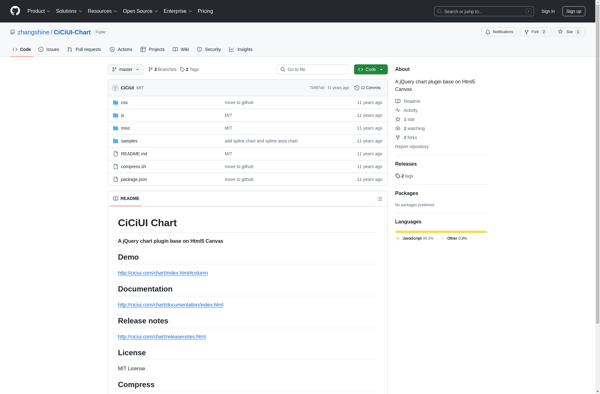
CiCiUI Chart
Create a chart online
Chart Templates

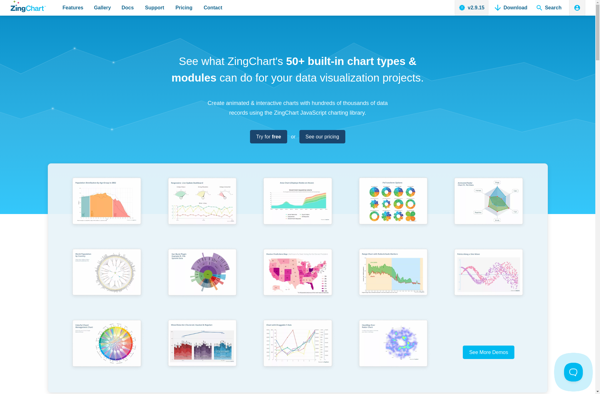
ZingChart
D3plus

N3-charts

AnyChart

PykCharts.js
EJSCharts

CanvasXpress
