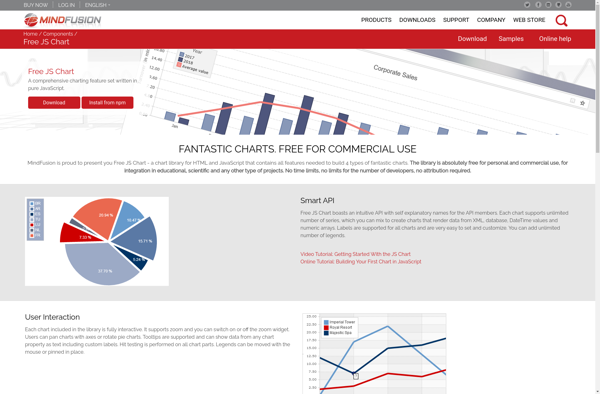
Free JS Chart is an open source JavaScript charting library that allows you to create different types of charts and graphs dynamically using JavaScript and HTML5 Canvas. It is free to use and customize.
Free JS Chart: Open Source JavaScript Charting Library
Free JS Chart is an open source JavaScript charting library that allows you to create different types of charts and graphs dynamically using JavaScript and HTML5 Canvas. It is free to use and customize.
What is Free JS Chart?
Free JS Chart is an open source JavaScript charting library that allows you to easily create different types of interactive charts and graphs using JavaScript and HTML5 Canvas element. It is completely free to use and customize as per your requirements.
Some key features of Free JS Chart:
Supports various chart types like line, bar, pie, doughnut, area, scatter, radar etc.
Interactive charts with animation and smooth transitions
Touch friendly charts that work seamlessly on mobile devices
Highly customizable - colors, labels, legends, tooltips, axes etc.
No external dependencies, uses native JavaScript and HTML5
Lightweight library with optimized performance
Compatible with all modern browsers
MIT license for unrestricted modification and distribution
Free JS Chart simplifies chart creation process without needing any specialized skills. With simple JavaScript code, you can add interactive animated charts in your web or mobile applications. And being open source, you get full control to customize the library to suit your specific needs.
Free JS Chart Features
Features
Supports various chart types like line, bar, pie, doughnut, radar, polar area, etc
Interactive and animated charts
Customizable axes, legends, tooltips, etc
Touch support for mobile devices
Canvas rendering for better performance
Open source and free to use
Pricing
Open Source
Pros
Free and open source
Lightweight and easy to integrate
Good documentation
Lots of examples and demos
Good selection of chart types
Customizable and themeable
Works well on mobile devices
Cons
Less advanced features compared to commercial libraries
Google Charts is a robust and flexible JavaScript charting and data visualization library provided for free by Google. It offers developers a highly customizable way to create interactive charts, graphs, and data tables that seamlessly integrate into web pages and applications.With Google Charts, you can visualize complex data sets and...
Plotly is an open-source graphing library that allows users to create interactive, publication-quality graphs, charts, and dashboards. It supports Python, R, JavaScript, and Excel as programming languages. Some key features of Plotly include:Interactive visualization - Plotly charts are interactive with features like hover text, zooming, panning, selectable legends, and editable...
Highcharts is an advanced JavaScript charting library used to visualize data and create interactive charts and graphs in web applications. Originally developed in 2009 by Highsoft AS, Highcharts allows developers to quickly add charts and graphs to their web pages with support for a wide variety of chart types out...
CanvasJS Charts is a feature-rich JavaScript HTML5 charting library that enables interactive charts, graphs and data visualizations in web applications and sites. It is free for non-commercial use and offers over 30 different chart types including line, area, column, bar, pie, doughnut, funnel, polar, radar, range and more.Some key features...
Chart.js is an open-source JavaScript library that allows developers to easily create responsive, interactive data visualizations and charts using HTML5 Canvas. Some key things to know about Chart.js:Supports 8 chart types out of the box: line, bar, radar, polar, pie, doughnut, scatter, and bubble chartsUses HTML5 Canvas for rendering charts,...
ChartBlocks is a business intelligence and data visualization software used to create interactive charts, dashboards, and reports for better data analysis. It provides an easy drag-and-drop interface to build visualizations quickly without the need for coding.Some key features of ChartBlocks include:Drag-and-drop functionality to create various charts like bar, line, pie,...
amCharts is a feature-rich JavaScript charting library that enables you to create interactive charts, dashboards, and data visualizations. With amCharts, you can build solutions for both web and mobile platforms.Some key capabilities and benefits of amCharts include:Supports a wide variety of chart types: line, column, bar, pie, radar, scatter, gauges,...
ZoomCharts is a feature-rich JavaScript charting library used to create interactive data visualizations for web applications and dashboards. With over 90 chart types to choose from, including line, bar, pie, map, scatter, and more, ZoomCharts provides the flexibility to represent data in a meaningful way.Some of the key capabilities and...
Essential JS 2 for JavaScript by Syncfusion is a complete JavaScript UI components library for building modern web applications. It includes over 60 high-performance, lightweight, modular, and responsive UI components ranging from interactive data visualization components like charts, treemaps, heat maps to editing components like rich text editor, spreadsheet and...
Frappé Charts is an open source data visualization library built on Python and JavaScript. It offers a wide variety of interactive charts and graphs including line, area, bar, pie, donut, scatter, heat maps and more. The key features of Frappé Charts include:Simple and intuitive drag-and-drop interface to create visualizationsSupport for...
Koia is an open-source, self-hosted alternative to Canva's web-based graphic design platform. Like Canva, Koia provides an intuitive drag-and-drop interface and a wide range of templates and design assets to help users with no design experience easily create stunning graphics, presentations, posters, brochures, resumes, invitations and more for business, education,...
AnyChart is a feature-rich JavaScript charting library that enables developers to easily add interactive charts and dashboards to web and mobile applications. With its lightweight architecture, AnyChart aims to provide high performance chart rendering optimized even for large datasets.AnyChart supports over 80 chart types including column, bar, line, area, pie,...