Essential JS 2 for JavaScript by Syncfusion

Essential JS 2 for JavaScript by Syncfusion

Essential JS 2 is a JavaScript UI components library by Syncfusion that includes over 60 high-performance, lightweight, modular, and responsive UI components for building modern web applications. It has features like data visualization, grids, charts, schedulers, and editors.
Essential JS 2 for JavaScript by Syncfusion image
ui-components data-visualization grids charts schedulers editors web-development

Essential JS 2: High-Performance JavaScript UI Components

Essential JS 2 is a JavaScript UI components library by Syncfusion that includes over 60 high-performance, lightweight, modular, and responsive UI components for building modern web applications. It has features like data visualization, grids, charts, schedulers, and editors.

What is Essential JS 2 for JavaScript by Syncfusion?

Essential JS 2 for JavaScript by Syncfusion is a complete JavaScript UI components library for building modern web applications. It includes over 60 high-performance, lightweight, modular, and responsive UI components ranging from interactive data visualization components like charts, treemaps, heat maps to editing components like rich text editor, spreadsheet and scheduling components like event calendar, gantt chart, and data grid components.

Some key capabilities and benefits of Essential JS 2 include:

  • Open source and free to use under community license
  • Modular architecture allowing to use only the components needed
  • Touch friendly and responsive support for mobile and tablet devices
  • Speed and performance focused components up to 60 frames per second
  • Bootstrap support for easy theming and integration
  • Client side data binding with outstanding spreadsheet and pivot grid components
  • Advanced chart types like financial charts, box and whisker, error bar, waterfall, etc.
  • Localization support for over 44 languages

Essential JS 2 targets complex line-of-business application development with components like gantt, scheduler, charts and data grid which can connect to local and remote data sources like RESTful JSON, OData and WCF services and bind data easily for dashboard, reporting and analytic applications.

Essential JS 2 for JavaScript by Syncfusion Features

Features

  1. Data Visualization
  2. Client Side Grids
  3. Charts
  4. Schedulers
  5. Editors

Pricing

  • Subscription-Based

Pros

Large set of UI components

Good documentation

Customizable and themeable

Good performance

Cons

Steep learning curve

Can be expensive for larger applications

Heavy footprint


The Best Essential JS 2 for JavaScript by Syncfusion Alternatives

Top Development and Javascript Libraries & Frameworks and other similar apps like Essential JS 2 for JavaScript by Syncfusion


DataTables icon

DataTables

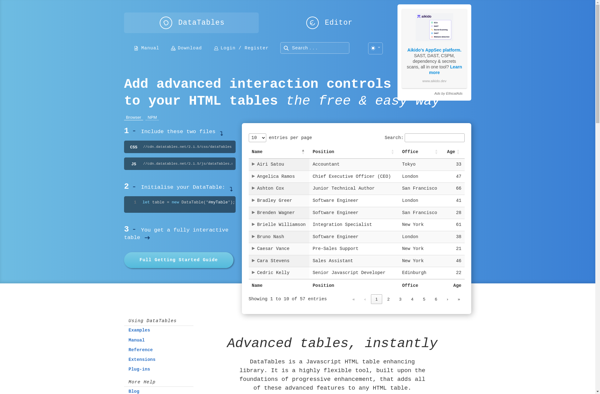
DataTables is an open source jQuery plugin that enhances the functionality and interactivity of HTML tables. It provides features like searching, sorting, filtering, and pagination that make large data sets in tables more manageable and user-friendly.Some key features of DataTables include:Search box - Allows users to quickly search for data...
DataTables image
Ag-Grid icon

Ag-Grid

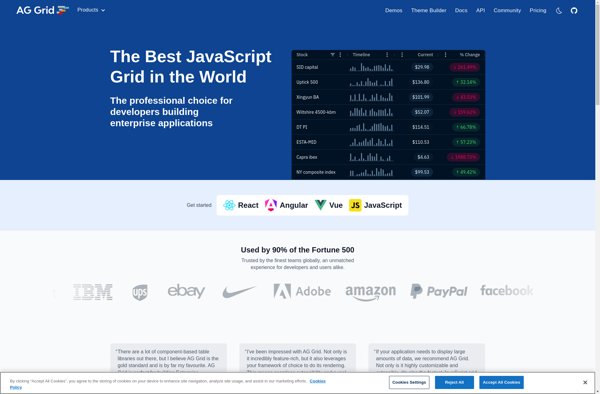
ag-Grid is an advanced JavaScript data grid component built for high performance enterprise applications. Key capabilities and benefits include:Rich in-cell editing - allow users to edit data directly in the gridCustomizable cell rendering - full control over how data is displayed in cellsColumn grouping & aggregation - group and aggregate...
Ag-Grid image
Webix DataTable icon

Webix DataTable

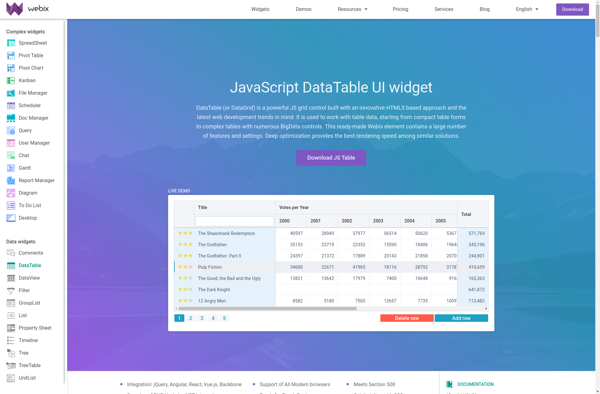
Webix DataTable is a feature-rich JavaScript grid (table) component for displaying, manipulating, and working with tabular data. It is part of the Webix UI library.Key features of Webix DataTable include:Displaying data from local datasets, JSON, XML, CSV files, or remote data via APISorting, filtering, paging for efficient data manipulationInline and...
Webix DataTable image
Chart.js icon

Chart.js

Chart.js is an open-source JavaScript library that allows developers to easily create responsive, interactive data visualizations and charts using HTML5 Canvas. Some key things to know about Chart.js:Supports 8 chart types out of the box: line, bar, radar, polar, pie, doughnut, scatter, and bubble chartsUses HTML5 Canvas for rendering charts,...
Chart.js image
OpenUI5 icon

OpenUI5

OpenUI5 is an open source JavaScript framework sponsored by SAP for building enterprise-ready web applications. It builds on established web standards like HTML5, CSS, and JavaScript and provides a comprehensive library of responsive user interface controls like tables, charts, menus and forms.Some key features of OpenUI5 include:100+ responsive UI controls...
OpenUI5 image
Handsontable icon

Handsontable

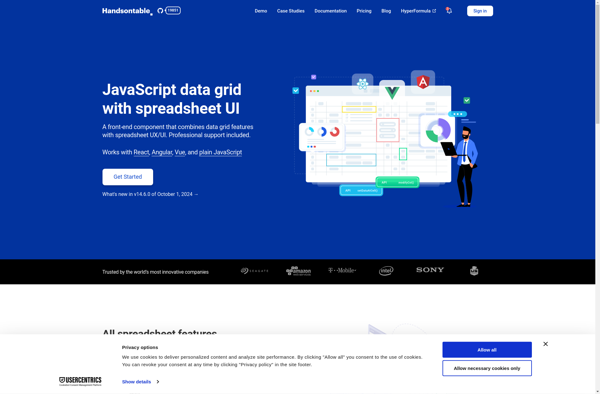
Handsontable is an open-source JavaScript/HTML5 spreadsheet component for building interactive web applications. It allows developers to easily add Excel-like grids, tables and data containers to their web apps or sites.Some key features of Handsontable include:Fast data rendering, with support for large datasetsIntuitive Excel-like grid UI and shortcutsData binding to JavaScript...
Handsontable image
Chartist.js icon

Chartist.js

Chartist.js is a lightweight, open-source charting library built with SVG. It was designed to be simple, responsive, and highly customizable using CSS and SVG animations.Some key features of Chartist.js include:Supports line, bar, pie and other chart typesAnimated chart transitions and interactionsResponsive - charts adapt to any screen sizeHighly customizable with...
Chartist.js image
RevoGrid icon

RevoGrid

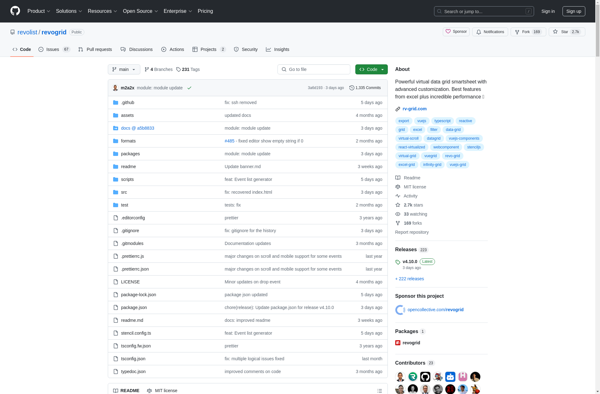
RevoGrid is an open-source data grid component for web browsers. It was designed to handle complex data grids easily, allowing developers to build Excel-like tables and data editors quickly.Some key features and benefits of RevoGrid:- Fast and lightweight - uses virtual scrolling to handle large datasets easily- Simplified API for...
RevoGrid image
ApexCharts icon

ApexCharts

ApexCharts is an open source JavaScript charting library aimed at providing simple yet highly customizable plots for web applications. Released in 2018, ApexCharts enables developers to rapidly build rich visualizations with ease and maintainability.Some key capabilities and benefits of ApexCharts include:Support for a wide variety of chart types - line,...
ApexCharts image
ZingGrid icon

ZingGrid

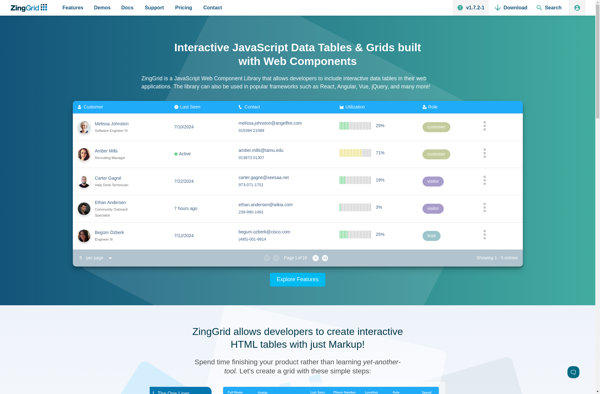
ZingGrid is an open-source JavaScript data grid library designed for building interactive data tables and grids for web applications. Here are some key details about ZingGrid:Lightweight codebase that is easy to integrate into new or existing projectsIntuitive API for binding data, handling events, customizing appearanceFamiliar spreadsheet-style features like sorting, filtering,...
ZingGrid image
PrimeNG icon

PrimeNG

PrimeNG is an open source UI component library for Angular that provides over 90 UI components, including buttons, charts, datatables, menus, trees, and more. It allows developers to build responsive web applications rapidly using pre-built UI components.Some key features of PrimeNG:Over 90 UI components for AngularTheming support with pre-built Material...
PrimeNG image
DevExtreme icon

DevExtreme

DevExtreme is an open-source HTML5 JavaScript framework developed by DevExpress for building modern web applications that run on all major platforms and devices. It includes a comprehensive collection of over 70 responsive UI components like data grid, pivot grid, charts, schedule, tree view and other widgets for rapid and simple...
DevExtreme image
Grid.js icon

Grid.js

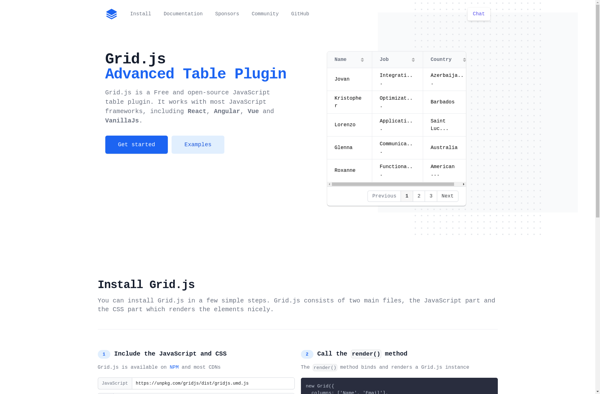
Grid.js is an open-source JavaScript data grid library developed by Afshin Mehrabani. It is designed to provide an easy way to display tabular data with rich features. Some key things to know about Grid.js:Lightweight - It has no external dependencies and aims to offer excellent performance.Mobile-friendly - It works smoothly...
Grid.js image
Zino UI icon

Zino UI

Zino UI is an open-source user interface toolkit for building cross-platform desktop applications using modern web technologies like HTML, CSS and JavaScript. It allows developers to design rich user interfaces like they do for web applications, but package them into desktop applications that can run on Windows, Mac and Linux.Some...
Zino UI image
Alloyui icon

Alloyui

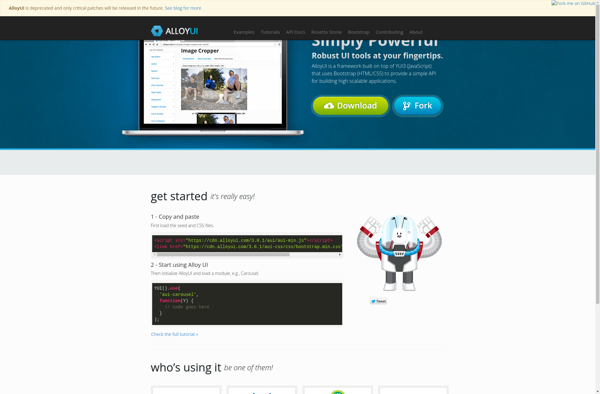
AlloyUI is an open-source JavaScript user interface library developed and maintained by Liferay. First released in 2012, AlloyUI provides over 100 reusable UI components to build interactive web applications and sites.Some of the key components in AlloyUI include:Buttons, menus, and toolbarsForms, input groups, and validationTables, grids, data listsTabs, accordions, modals,...
Alloyui image
Ninja UI icon

Ninja UI

Ninja UI is an open-source user interface design and prototyping tool for web applications and websites. It allows designers and developers to rapidly create wireframes, prototypes, mockups and hi-fidelity designs.Some key features of Ninja UI include:Drag-and-drop interface for quick UI buildingLibrary of custom widgets and componentsTools for crafting responsive designs...
Ninja UI image
Free JS Chart icon

Free JS Chart

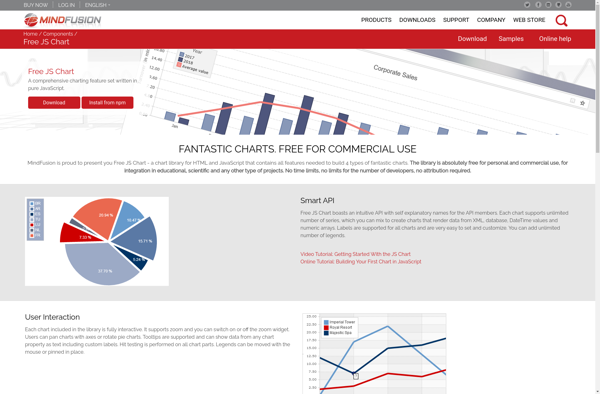
Free JS Chart is an open source JavaScript charting library that allows you to easily create different types of interactive charts and graphs using JavaScript and HTML5 Canvas element. It is completely free to use and customize as per your requirements.Some key features of Free JS Chart:Supports various chart types...
Free JS Chart image
Shield UI icon

Shield UI

Shield UI is a user interface component library designed to help web developers quickly build feature-rich, high-performance web applications. It includes a variety of JavaScript-based UI components for data visualization and interaction, including:Data grid - A high-performance data table that supports sorting, filtering, editing, exporting and other advanced features out...
Shield UI image