Chart.js is an open-source JavaScript library that allows developers to easily create responsive, interactive data visualizations and charts using HTML5 Canvas. It supports 8 chart types including line, bar, radar, polar, pie, doughnut, scatter, and bubble charts.
Chart.js: Open-Source JavaScript Library for Responsive Data Visualizations
Chart.js is an open-source JavaScript library that allows developers to easily create responsive, interactive data visualizations and charts using HTML5 Canvas. It supports 8 chart types including line, bar, radar, polar, pie, doughnut, scatter, and bubble charts.
What is Chart.js?
Chart.js is an open-source JavaScript library that allows developers to easily create responsive, interactive data visualizations and charts using HTML5 Canvas. Some key things to know about Chart.js:
Supports 8 chart types out of the box: line, bar, radar, polar, pie, doughnut, scatter, and bubble charts
Uses HTML5 Canvas for rendering charts, providing great performance across all modern browsers
Completely responsive and scales graphics perfectly on all screen sizes
Tons of customization options for colors, tooltips, animation, layouts, etc.
No dependencies, lightweight codebase that's simple to implement and use
Great documentation and active development community on GitHub
Overall, Chart.js strikes a great balance between ease-of-use and customizability. It's a great choice for developers looking to add interactive, flexible charts/graphs to their web apps or sites without needing to master complex data viz libraries. The simple API, responsive graphics and broad browser support makes integrating Chart.js a seamless process.
CanvasJS Charts is a feature-rich JavaScript HTML5 charting library that enables interactive charts, graphs and data visualizations in web applications and sites. It is free for non-commercial use and offers over 30 different chart types including line, area, column, bar, pie, doughnut, funnel, polar, radar, range and more.Some key features...
amCharts is a feature-rich JavaScript charting library that enables you to create interactive charts, dashboards, and data visualizations. With amCharts, you can build solutions for both web and mobile platforms.Some key capabilities and benefits of amCharts include:Supports a wide variety of chart types: line, column, bar, pie, radar, scatter, gauges,...
D3.js, or D3, is an open-source JavaScript library used for visualizing data with web standards. D3 stands for Data-Driven Documents. It allows developers to bind arbitrary data to the Document Object Model (DOM) and then apply data-driven transformations to the document. This allows web developers to create dynamic, interactive data...
C3.js is an open-source JavaScript library for generating clear and attractive charts. It is a wrapper built on top of D3.js that simplifies common chart types like line, bar, pie, scatter, stacked graphs, etc. The goal is to provide an easy way for web developers to visualize data without writing...
Chartist.js is a lightweight, open-source charting library built with SVG. It was designed to be simple, responsive, and highly customizable using CSS and SVG animations.Some key features of Chartist.js include:Supports line, bar, pie and other chart typesAnimated chart transitions and interactionsResponsive - charts adapt to any screen sizeHighly customizable with...
ApexCharts is an open source JavaScript charting library aimed at providing simple yet highly customizable plots for web applications. Released in 2018, ApexCharts enables developers to rapidly build rich visualizations with ease and maintainability.Some key capabilities and benefits of ApexCharts include:Support for a wide variety of chart types - line,...
Picasso.js is an open-source JavaScript charting library built on top of the HTML5 Canvas element. It provides a simple yet powerful API for easily creating rich and interactive data visualizations and charts in the browser.Some of the key features of Picasso.js include:Supports a wide variety of chart types out of...
Vis.js is an open source data visualization library built with JavaScript. It allows developers to create interactive visualizations such as timelines, networks and graphs easily in the browser using web standards.Some of the key features of Vis.js include:Various data visualization modules for timelines, networks, graphs etc.Easily customizable and extensible to...
liveGap Charts is an open-source JavaScript charting library used to build customizable, interactive data visualizations for the web. Developed by liveGap's engineering team, it was designed to provide an intuitive way to visualize data and create rich user experiences.Some key features of liveGap Charts include:Support for a wide variety of...
Essential JS 2 for JavaScript by Syncfusion is a complete JavaScript UI components library for building modern web applications. It includes over 60 high-performance, lightweight, modular, and responsive UI components ranging from interactive data visualization components like charts, treemaps, heat maps to editing components like rich text editor, spreadsheet and...
Smoothie Charts is an open-source JavaScript charting library designed specifically for real-time streaming data visualization. Some key features include:Optimized for line, bar, scatter, spline, and area graphs using canvasFast animation with a small code footprint suitable for embedded devicesHandles large volumes of real-time data without dropping framesCustomizable scales, interpolation modes,...
Frappé Charts is an open source data visualization library built on Python and JavaScript. It offers a wide variety of interactive charts and graphs including line, area, bar, pie, donut, scatter, heat maps and more. The key features of Frappé Charts include:Simple and intuitive drag-and-drop interface to create visualizationsSupport for...
morris.js is an open-source JavaScript charting library that allows for simple creation of responsive, stylish charts and graphs. Some key features include:Light-weight and customizable architecture based on jQuery and Raphaël for cross-browser compatibilitySupports SVG, Canvas and CSS rendering for graphs and chartsOffers a variety of chart types - line, bar,...
uvCharts is an open-source JavaScript charting library for building interactive data visualizations for the web. Some key features and benefits of uvCharts include:Open source and completely free to useLightweight at only 15kB gzippedSupports a wide variety of chart types including line, bar, pie, scatter, area charts and moreExtensive customization options...
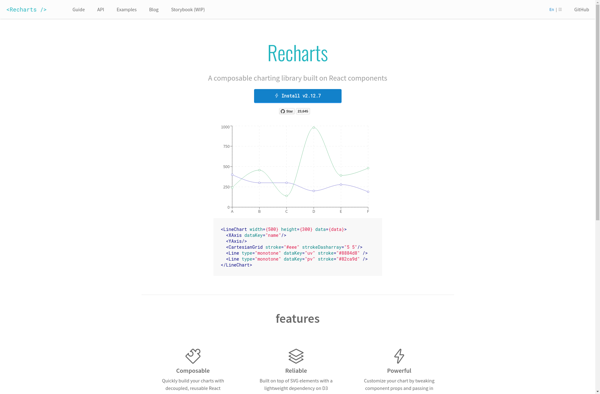
Recharts is an open-source React charting library used to build various data visualizations and interactive charts. It is Declarative, Component-Based, and highly customizable to create charts such as line, bar, pie, radar, scatter, treemap and more.Some key features of Recharts:Supports both SVG and Canvas rendering using a unified APIResponsive design...
Chartkick is an open-source charting library for Ruby on Rails applications. It provides a simple domain-specific language for generating interactive charts and graphs without writing any JavaScript. Chartkick supports various chart types like line charts, pie charts, column charts, bar charts and more.Some key features of Chartkick:Easy integration into Rails...
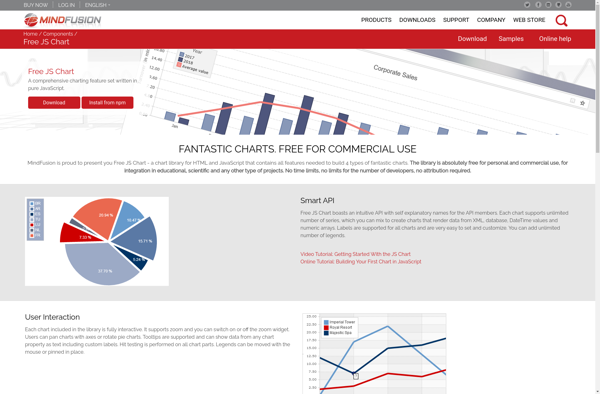
Free JS Chart is an open source JavaScript charting library that allows you to easily create different types of interactive charts and graphs using JavaScript and HTML5 Canvas element. It is completely free to use and customize as per your requirements.Some key features of Free JS Chart:Supports various chart types...
Ember Charts is an open-source JavaScript charting library built for use in Ember.js applications. It provides a set of reusable Ember components and services to help developers quickly add beautiful, interactive charts and graphs to their apps.Key features of Ember Charts include:Tight integration with Ember's data layer - easily bind...
n3-charts is a feature-rich JavaScript charting library for adding interactive data visualizations to web apps and sites. Developed with focus on performance, customizability and ease-of-use, n3-charts allows developers to quickly build various types of charts and graphs to effectively visualize data.With n3-charts, you can create line, bar, column, area, pie,...
AnyChart is a feature-rich JavaScript charting library that enables developers to easily add interactive charts and dashboards to web and mobile applications. With its lightweight architecture, AnyChart aims to provide high performance chart rendering optimized even for large datasets.AnyChart supports over 80 chart types including column, bar, line, area, pie,...
EJSCharts is a flexible JavaScript charting library for adding interactive charts and graphs to web applications and sites. It is built on top of the EJ2 JavaScript library and integrates seamlessly with other Syncfusion UI components.With EJSCharts, you can create over 35 chart types including line, area, bar, pie, doughnut,...