liveGap Charts is an open-source JavaScript charting library for building interactive visualizations. It offers support for various chart types like line, bar, pie and more. The library is lightweight, customizable and works across devices.
liveGap Charts is an open-source JavaScript charting library for building interactive visualizations. It offers support for various chart types like line, bar, pie and more. The library is lightweight, customizable and works across devices.
What is LiveGap Charts?
liveGap Charts is an open-source JavaScript charting library used to build customizable, interactive data visualizations for the web. Developed by liveGap's engineering team, it was designed to provide an intuitive way to visualize data and create rich user experiences.
Some key features of liveGap Charts include:
Support for a wide variety of chart types including line, bar, pie, donut, radar, polar, and more
Responsive design that automatically adapts charts to any screen size
Extensive customization options for colors, labels, tooltips, axes, and other graphical elements
Animation support for creating engaging, fluid transitions and interactions
Broad browser support including Chrome, Firefox, Safari, Edge, and IE11
Lightweight footprint that aims to optimize performance
Integration with popular frameworks like React, Angular and Vue
MIT license for free commercial and non-commercial use
liveGap Charts aims to provide an easy way for developers of all skill levels to create beautiful, informative charts and dashboards. Its flexibility makes it a popular choice for data visualization on the web.
LiveGap Charts Features
Features
Supports various chart types like line, bar, pie, donut, radar, polar, etc.
Interactive and animated charts
Customizable axes, legends, tooltips, etc.
Responsive design that works across devices
Lightweight library with no dependencies
Open-source and free to use
Pricing
Open Source
Pros
Easy to get started and integrate
Very customizable and flexible
Good documentation and examples
Active development and maintenance
Free and open source
Cons
Less chart types than some competitors
Lacks some advanced features like 3D or stock charts
Google Charts is a robust and flexible JavaScript charting and data visualization library provided for free by Google. It offers developers a highly customizable way to create interactive charts, graphs, and data tables that seamlessly integrate into web pages and applications.With Google Charts, you can visualize complex data sets and...
Plotly is an open-source graphing library that allows users to create interactive, publication-quality graphs, charts, and dashboards. It supports Python, R, JavaScript, and Excel as programming languages. Some key features of Plotly include:Interactive visualization - Plotly charts are interactive with features like hover text, zooming, panning, selectable legends, and editable...
Highcharts is an advanced JavaScript charting library used to visualize data and create interactive charts and graphs in web applications. Originally developed in 2009 by Highsoft AS, Highcharts allows developers to quickly add charts and graphs to their web pages with support for a wide variety of chart types out...
CanvasJS Charts is a feature-rich JavaScript HTML5 charting library that enables interactive charts, graphs and data visualizations in web applications and sites. It is free for non-commercial use and offers over 30 different chart types including line, area, column, bar, pie, doughnut, funnel, polar, radar, range and more.Some key features...
Chart.js is an open-source JavaScript library that allows developers to easily create responsive, interactive data visualizations and charts using HTML5 Canvas. Some key things to know about Chart.js:Supports 8 chart types out of the box: line, bar, radar, polar, pie, doughnut, scatter, and bubble chartsUses HTML5 Canvas for rendering charts,...
D3.js, or D3, is an open-source JavaScript library used for visualizing data with web standards. D3 stands for Data-Driven Documents. It allows developers to bind arbitrary data to the Document Object Model (DOM) and then apply data-driven transformations to the document. This allows web developers to create dynamic, interactive data...
C3.js is an open-source JavaScript library for generating clear and attractive charts. It is a wrapper built on top of D3.js that simplifies common chart types like line, bar, pie, scatter, stacked graphs, etc. The goal is to provide an easy way for web developers to visualize data without writing...
NVD3 is an open-source JavaScript charting library used to build interactive data visualizations in web browsers. It is based on D3.js and reuses parts of the D3 codebase to create reusable charts. NVD3 aims to simplify and streamline D3 code for faster web development.Some key features of NVD3 include:Over a...
ZoomCharts is a feature-rich JavaScript charting library used to create interactive data visualizations for web applications and dashboards. With over 90 chart types to choose from, including line, bar, pie, map, scatter, and more, ZoomCharts provides the flexibility to represent data in a meaningful way.Some of the key capabilities and...
ApexCharts is an open source JavaScript charting library aimed at providing simple yet highly customizable plots for web applications. Released in 2018, ApexCharts enables developers to rapidly build rich visualizations with ease and maintainability.Some key capabilities and benefits of ApexCharts include:Support for a wide variety of chart types - line,...
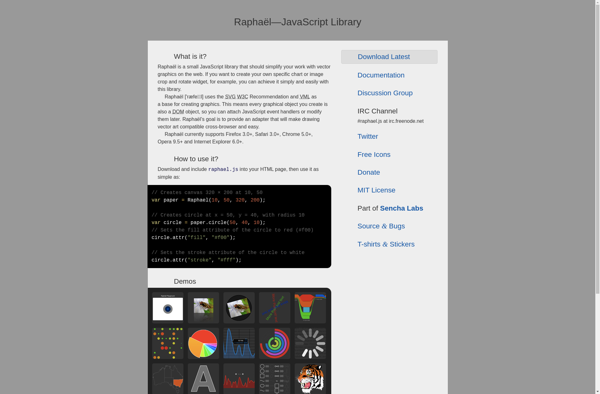
Raphaël is a JavaScript library that focuses on providing an easy way for web developers to incorporate vector graphics, visualization, and animation into their web pages and applications. It is designed to provide a single API that works consistently across all major browsers, both modern and legacy.Raphaël uses either SVG...
Charts 4 PHP is an open-source and free PHP charting library that allows developers to create interactive charts, graphs and data visualizations using PHP. It provides an easy way to visualize data on web applications and sites built with PHP.Some key features of Charts 4 PHP:Supports various chart types including...
Frappé Charts is an open source data visualization library built on Python and JavaScript. It offers a wide variety of interactive charts and graphs including line, area, bar, pie, donut, scatter, heat maps and more. The key features of Frappé Charts include:Simple and intuitive drag-and-drop interface to create visualizationsSupport for...
RAWGraphs is a free, open-source web tool created for anyone to easily visualize and share data using the most common graphical formats. The simple drag and drop interface makes it easy for non-experts to quickly generate a wide variety of charts and diagrams that can be exported and shared as...
ArcadiaCharts is an open-source JavaScript charting library for building interactive data visualizations for the web. With ArcadiaCharts, you can create various types of charts like line charts, bar charts, pie charts, scatter plots, area charts, and more.Some key features and capabilities of ArcadiaCharts include:Support for animation and transitions for more...
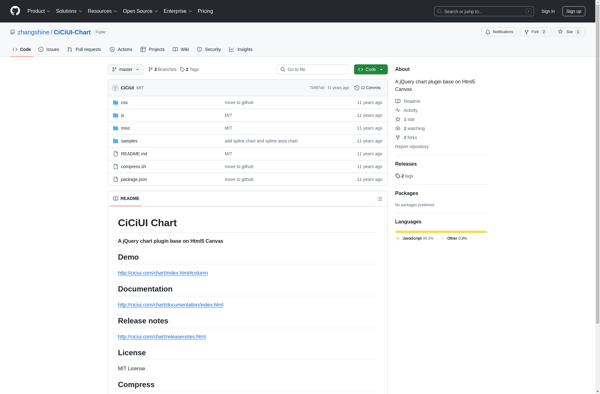
CiCiUI Chart is a feature-rich JavaScript charting library built on HTML5 Canvas element. It allows developers to easily create highly customizable, interactive charts and graphs and embed them into web pages and applications.Some key features and capabilities of CiCiUI Chart include:Supports a wide variety of chart types out of the...
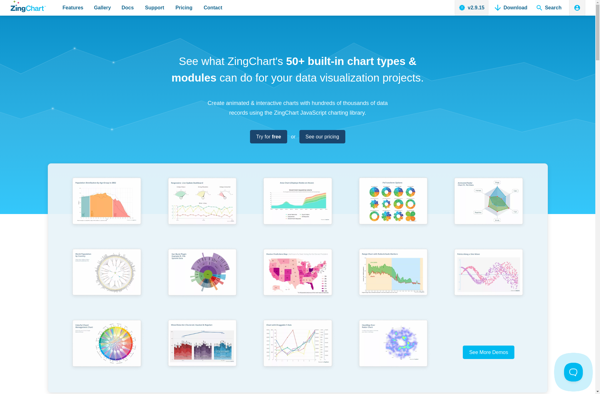
ZingChart is a feature-rich JavaScript charting library used to build interactive and animated data visualizations. It offers over 30 customizable chart types including line, column, bar, pie, scatter plots, heatmaps and more. With the ability to completely style and brand charts using CSS and theme builders, ZingChart provides the flexibility...
AnyChart is a feature-rich JavaScript charting library that enables developers to easily add interactive charts and dashboards to web and mobile applications. With its lightweight architecture, AnyChart aims to provide high performance chart rendering optimized even for large datasets.AnyChart supports over 80 chart types including column, bar, line, area, pie,...
PykCharts.js is an open source JavaScript charting library for building highly customizable and interactive data visualizations and charts using web technologies. It is built on top of the popular D3.js library.Key features of PykCharts include:Support for various chart types like line, bar, pie, donut, scatter, bubble maps etc.Interactive charts with...