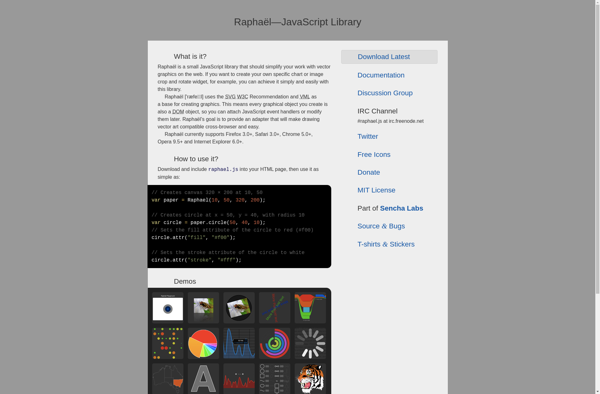
Raphaël is a small JavaScript library that provides cross-browser vector graphics scripting. It allows developers to easily create vector graphics and animations without needing to directly use SVG or VML code. It supports older browsers like Internet Explorer 6.
A small JavaScript library providing cross-browser vector graphics scripting, allowing developers to create vector graphics and animations without using SVG or VML code, supporting older browsers like Internet Explorer 6.
What is Raphaël?
Raphaël is a JavaScript library that focuses on providing an easy way for web developers to incorporate vector graphics, visualization, and animation into their web pages and applications. It is designed to provide a single API that works consistently across all major browsers, both modern and legacy.
Raphaël uses either SVG or VML to render the graphics, depending on what the target browser supports. This allows the same code to create graphics that work seamlessly in everything from Firefox to Internet Explorer 6. The library handles all the details of generating standards-compliant SVG or VML markup behind the scenes.
Some of the key capabilities Raphaël provides include:
Vector drawing primitives like circles, paths, rectangles, ellipses, etc.
Transformations like scale, rotate, and translate
Color and opacity settings
Animation along paths or between states
Support for mouse events and interactivity
Simplified text rendering
Extensibility with plugins
Raphaël is designed to provide just the core vector and animation functionality that developers need for web graphics and visualization. It avoids cluttering things up with a lot of unnecessary features. The end result is a lightweight library that is both easy to learn and performant.
Websites that want to add engaging interactive graphics without having to rely on bitmap images or Flash often utilize Raphaël. It has become popular both for simple visualizations like charts and graphs as well as more advanced interactive interfaces. The extensive browser support and straightforward API make it very appealing for web developers working on the graphics/interactivity layer.
Anime.js is a lightweight JavaScript animation library that allows developers to animate elements on a website without relying on CSS or jQuery. Some key features of Anime.js include:Animates CSS properties like color, opacity, scroll, and moreWorks with SVG, DOM attributes, and JavaScript ObjectsSimple API and small file size (16kB minified+gzipped)Playback...
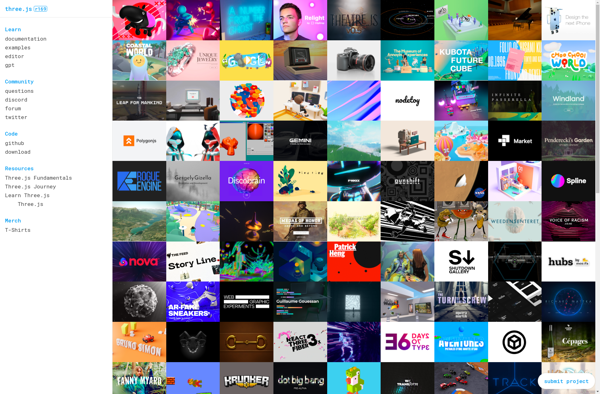
Three.js is an open-source JavaScript library and Application Programming Interface (API) used to create and display animated three-dimensional computer graphics in a web browser using WebGL. Three.js makes working with the WebGL API easier by providing helpful tools and abstractions on top of the low-level WebGL API.Some key capabilities and...
Paper.js is an open-source vector graphics scripting framework that runs on top of the HTML5 Canvas element. It provides developers and designers high-performance tools for animation, visualizations, games, and more.Some key capabilities and features of Paper.js include:Vector graphics rendering with WebGL hardware accelerationIntuitive scene graph and hierarchical transformations systemMath utilities...
ChartBlocks is a business intelligence and data visualization software used to create interactive charts, dashboards, and reports for better data analysis. It provides an easy drag-and-drop interface to build visualizations quickly without the need for coding.Some key features of ChartBlocks include:Drag-and-drop functionality to create various charts like bar, line, pie,...
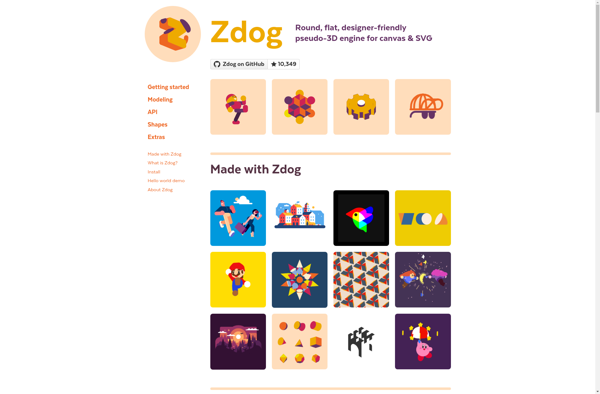
Zdog is a lightweight JavaScript library for creating 3D models and animations by constructing shapes out of flat surfaces. It uses SVG and WebGL rendering for high performance even on mobile devices.Key features of Zdog include:Simple, low-poly aesthetic with rounded corners, resembling cut paper or wooden blocksEasily customize color, size,...
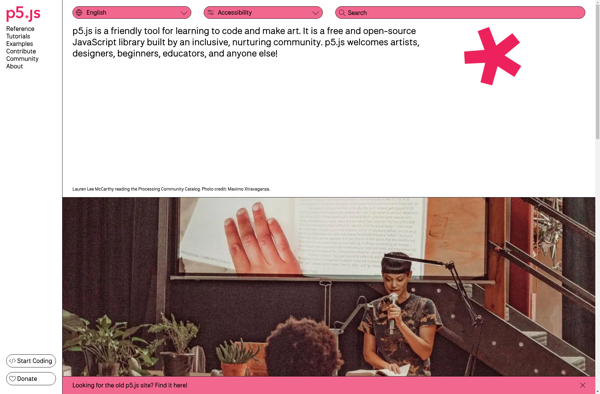
p5.js is a JavaScript library for creative coding, with a focus on making coding accessible and inclusive for artists, designers, educators, beginners, and anyone else. It is based on the core principles of Processing, but rebuilt for today's web.Some key features and strengths of p5.js:Powerful graphics, image, and sound libraries...
Open Flash Chart is an open-source JavaScript charting library used to create interactive Flash-based charts for web applications. It provides an easy way for developers to add advanced data visualizations and graphs to their websites without needing to write Flash code.Some key features of Open Flash Chart include:Support for various...
NVD3 is an open-source JavaScript charting library used to build interactive data visualizations in web browsers. It is based on D3.js and reuses parts of the D3 codebase to create reusable charts. NVD3 aims to simplify and streamline D3 code for faster web development.Some key features of NVD3 include:Over a...
dc.js is a JavaScript charting library that leverages d3.js and crossfilter for interactive dimensional charting and visual analysis of large datasets. Some key features of dc.js include:Integration with d3.js for powerful and flexible visualizationsTight integration with crossfilter for fast filtering and grouping of large datasetsFocus+Context and Brushing chart interactionsAnimated transitions...
Bokeh is an open-source Python library for creating interactive data visualizations for modern web browsers. It allows users to quickly construct versatile and high-performance graphics from simple plots to complex dashboards. Some key features of Bokeh include:Integration with common Python data science libraries like NumPy, Pandas, Scikit-Learn for easy data...
ZoomCharts is a feature-rich JavaScript charting library used to create interactive data visualizations for web applications and dashboards. With over 90 chart types to choose from, including line, bar, pie, map, scatter, and more, ZoomCharts provides the flexibility to represent data in a meaningful way.Some of the key capabilities and...
Snap.svg is a JavaScript library designed specifically for working with Scalable Vector Graphics (SVG) on the web. It provides a clean, friendly API that makes it easy to create, modify, animate, and interact with SVG elements using JavaScript.Some key features of Snap.svg include:Simple API for creating SVG elements like rects,...
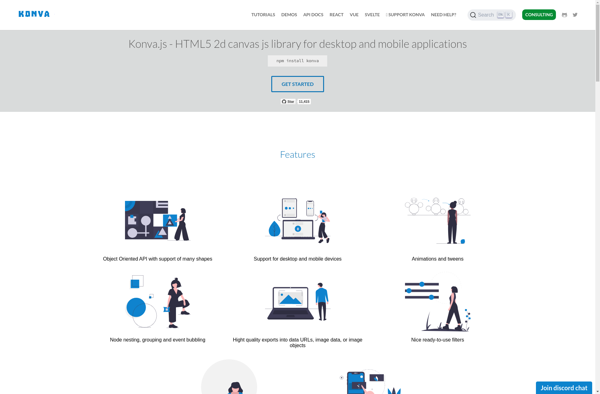
KonvaJS is an open source HTML5 canvas JavaScript framework for building high performance user interfaces and graphics. It allows developers to create animations, transitions, nesting, layering, filtering, caching, event handling etc. with high performance even on mobile devices.Some key features of KonvaJS:Lightweight - Only ~80kb gzippedFast rendering and animation with...
Charts 4 PHP is an open-source and free PHP charting library that allows developers to create interactive charts, graphs and data visualizations using PHP. It provides an easy way to visualize data on web applications and sites built with PHP.Some key features of Charts 4 PHP:Supports various chart types including...
liveGap Charts is an open-source JavaScript charting library used to build customizable, interactive data visualizations for the web. Developed by liveGap's engineering team, it was designed to provide an intuitive way to visualize data and create rich user experiences.Some key features of liveGap Charts include:Support for a wide variety of...
RGraph is an open source JavaScript charting library that allows developers to add interactive, customizable charts and graphs to web pages without needing a charting server backend. It is lightweight, easy to implement, and supports over 30 chart types including line, bar, pie, scatter, waterfall, funnel charts and more.Some key...
GraphicsJS is a feature-rich JavaScript graphics library for the HTML5 canvas element. It provides an easy-to-use API for generating, manipulating and animating graphics in the browser with JavaScript.Some of the key features of GraphicsJS include:Intuitive interface for drawing basic shapes like rectangles, circles, lines, polygons, as well as advanced shapes...
jqPlot is an advanced open source JavaScript charting library that builds customizable charts and graphs using the jQuery JavaScript library and HTML5 canvas elements. It provides an easy way for web developers to include rich, interactive charts in their web applications and websites.Some key features of jqPlot include:Supports various chart...
ArcadiaCharts is an open-source JavaScript charting library for building interactive data visualizations for the web. With ArcadiaCharts, you can create various types of charts like line charts, bar charts, pie charts, scatter plots, area charts, and more.Some key features and capabilities of ArcadiaCharts include:Support for animation and transitions for more...
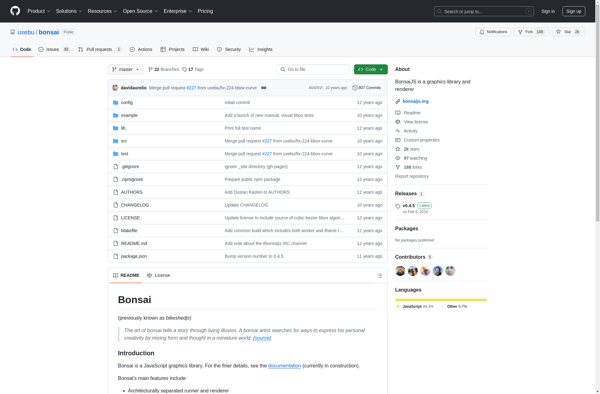
BonsaiJS is an open-source JavaScript graphics library for creating interactive 3D graphics in a web browser leveraging WebGL. Developed by Mozilla, BonsaiJS provides a high-level, declarative API that makes it easy for web developers to work with 3D without needing deep expertise in WebGL or OpenGL.Some key capabilities and benefits...
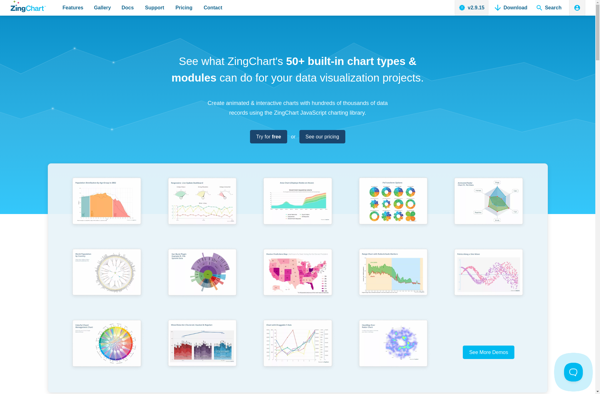
ZingChart is a feature-rich JavaScript charting library used to build interactive and animated data visualizations. It offers over 30 customizable chart types including line, column, bar, pie, scatter plots, heatmaps and more. With the ability to completely style and brand charts using CSS and theme builders, ZingChart provides the flexibility...
StageXL is an open-source Flash runtime engine written entirely in JavaScript. It allows developers to create hardware-accelerated 2D content for the web using a Flash-like API and workflow. StageXL implements major parts of the Flash API to provide a familiar development experience for those coming from a Flash background.Some key...