jqPlot is an open source JavaScript charting library built on top of the jQuery JavaScript library. It allows developers to easily create interactive charts and graphs for web applications.
An open source JavaScript charting library built on top of jQuery, enabling easy creation of interactive charts and graphs for web applications.
What is JqPlot?
jqPlot is an advanced open source JavaScript charting library that builds customizable charts and graphs using the jQuery JavaScript library and HTML5 canvas elements. It provides an easy way for web developers to include rich, interactive charts in their web applications and websites.
Some key features of jqPlot include:
Supports various chart types like line charts, bar charts, pie charts etc.
Options for controlling all visual aspects of charts including colors, fonts, axes, grid lines etc.
Animations, zooming and panning on chart interactions.
Client side data processing and rendering.
Date axes with customized tick formatting.
Supports large datasets.
Event handling for chart interactions.
Customizable legend options.
Export chart images to PNG or transparent PNG.
Compatible with all modern browsers.
jqPlot charts handle client side data processing and rendering, reducing server load. The library is highly customizable to generate great looking charts with animations and interactions. Many options are available to control the chart aesthetics and behaviors. jqPlot has good documentation and developer community for support.
Google Charts is a robust and flexible JavaScript charting and data visualization library provided for free by Google. It offers developers a highly customizable way to create interactive charts, graphs, and data tables that seamlessly integrate into web pages and applications.With Google Charts, you can visualize complex data sets and...
Highcharts is an advanced JavaScript charting library used to visualize data and create interactive charts and graphs in web applications. Originally developed in 2009 by Highsoft AS, Highcharts allows developers to quickly add charts and graphs to their web pages with support for a wide variety of chart types out...
CanvasJS Charts is a feature-rich JavaScript HTML5 charting library that enables interactive charts, graphs and data visualizations in web applications and sites. It is free for non-commercial use and offers over 30 different chart types including line, area, column, bar, pie, doughnut, funnel, polar, radar, range and more.Some key features...
amCharts is a feature-rich JavaScript charting library that enables you to create interactive charts, dashboards, and data visualizations. With amCharts, you can build solutions for both web and mobile platforms.Some key capabilities and benefits of amCharts include:Supports a wide variety of chart types: line, column, bar, pie, radar, scatter, gauges,...
C3.js is an open-source JavaScript library for generating clear and attractive charts. It is a wrapper built on top of D3.js that simplifies common chart types like line, bar, pie, scatter, stacked graphs, etc. The goal is to provide an easy way for web developers to visualize data without writing...
ZoomCharts is a feature-rich JavaScript charting library used to create interactive data visualizations for web applications and dashboards. With over 90 chart types to choose from, including line, bar, pie, map, scatter, and more, ZoomCharts provides the flexibility to represent data in a meaningful way.Some of the key capabilities and...
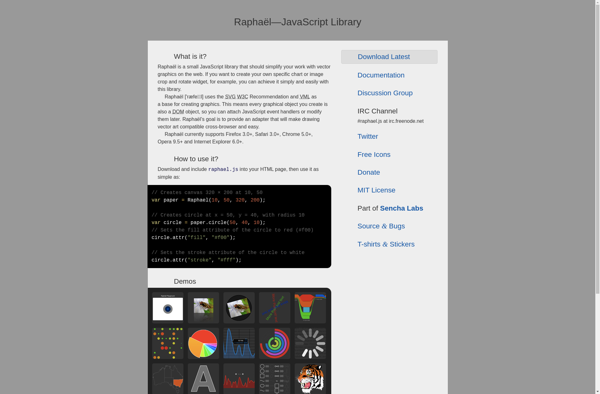
Raphaël is a JavaScript library that focuses on providing an easy way for web developers to incorporate vector graphics, visualization, and animation into their web pages and applications. It is designed to provide a single API that works consistently across all major browsers, both modern and legacy.Raphaël uses either SVG...
Vis.js is an open source data visualization library built with JavaScript. It allows developers to create interactive visualizations such as timelines, networks and graphs easily in the browser using web standards.Some of the key features of Vis.js include:Various data visualization modules for timelines, networks, graphs etc.Easily customizable and extensible to...
RGraph is an open source JavaScript charting library that allows developers to add interactive, customizable charts and graphs to web pages without needing a charting server backend. It is lightweight, easy to implement, and supports over 30 chart types including line, bar, pie, scatter, waterfall, funnel charts and more.Some key...
Chart Templates is charting software that provides a library of pre-designed chart and graph templates that can be customized to visualize data. It helps non-designers easily create professional, on-brand data visualizations for business uses.The software includes hundreds of templates for all types of charts - from basic bar, lines and...
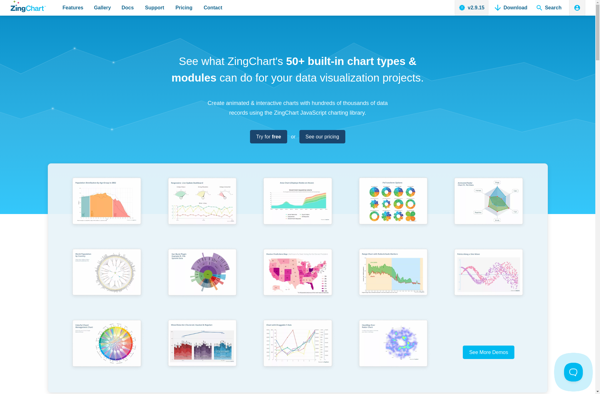
ZingChart is a feature-rich JavaScript charting library used to build interactive and animated data visualizations. It offers over 30 customizable chart types including line, column, bar, pie, scatter plots, heatmaps and more. With the ability to completely style and brand charts using CSS and theme builders, ZingChart provides the flexibility...
PykCharts.js is an open source JavaScript charting library for building highly customizable and interactive data visualizations and charts using web technologies. It is built on top of the popular D3.js library.Key features of PykCharts include:Support for various chart types like line, bar, pie, donut, scatter, bubble maps etc.Interactive charts with...