Chart Templates is a software that provides pre-made chart and graph templates that can be customized. It helps create professional data visualizations quickly for reports, presentations, infographics and more.
Chart Templates is a software that provides pre-made chart and graph templates that can be customized. It helps create professional data visualizations quickly for reports, presentations, infographics and more.
What is Chart Templates?
Chart Templates is charting software that provides a library of pre-designed chart and graph templates that can be customized to visualize data. It helps non-designers easily create professional, on-brand data visualizations for business uses.
The software includes hundreds of templates for all types of charts - from basic bar, lines and pie charts to more complex heatmaps, histograms and funnel charts. The templates are fully-editable so colors, fonts, styles and all design elements can be changed.
Key features include:
Hundreds of customizable chart template designs
Drag and drop editor to easily apply own data
Formatting options to tailor styles for company brand
Export visualizations as image files or PowerPoint slides
Create interactive charts and dashboards to embed in apps/sites
Comes with thousands of free icons and millions of images
With an easy-to-use editor requiring no design experience, Chart Templates helps teams quickly visualize data for reports, dashboards, presentations and infographics in just minutes instead of hours. It's affordable compared to hiring designers and saves time on data visualization creation.
Chart Templates Features
Features
Pre-made chart and graph templates
Customizable templates
Creates professional data visualizations
Suitable for reports, presentations, infographics, and more
Drag-and-drop functionality
Wide range of chart types
Collaboration and sharing features
Export options (e.g., PNG, SVG, PDF)
Pricing
Freemium
Subscription-Based
Pros
Saves time and effort in creating data visualizations
Google Charts is a robust and flexible JavaScript charting and data visualization library provided for free by Google. It offers developers a highly customizable way to create interactive charts, graphs, and data tables that seamlessly integrate into web pages and applications.With Google Charts, you can visualize complex data sets and...
Plotly is an open-source graphing library that allows users to create interactive, publication-quality graphs, charts, and dashboards. It supports Python, R, JavaScript, and Excel as programming languages. Some key features of Plotly include:Interactive visualization - Plotly charts are interactive with features like hover text, zooming, panning, selectable legends, and editable...
Highcharts is an advanced JavaScript charting library used to visualize data and create interactive charts and graphs in web applications. Originally developed in 2009 by Highsoft AS, Highcharts allows developers to quickly add charts and graphs to their web pages with support for a wide variety of chart types out...
CanvasJS Charts is a feature-rich JavaScript HTML5 charting library that enables interactive charts, graphs and data visualizations in web applications and sites. It is free for non-commercial use and offers over 30 different chart types including line, area, column, bar, pie, doughnut, funnel, polar, radar, range and more.Some key features...
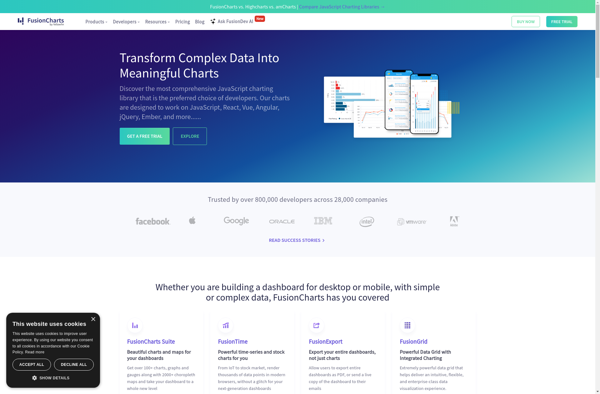
FusionCharts Suite XT is a comprehensive JavaScript charting solution that offers over 90 chart types including column, bar, pie, line, area, scatter, bubble charts and more. It also includes over 1100 maps including choropleth, markers, routes and more.Some key features of FusionCharts Suite XT:Interactive JavaScript charts, gauges and maps for...
amCharts is a feature-rich JavaScript charting library that enables you to create interactive charts, dashboards, and data visualizations. With amCharts, you can build solutions for both web and mobile platforms.Some key capabilities and benefits of amCharts include:Supports a wide variety of chart types: line, column, bar, pie, radar, scatter, gauges,...
D3.js, or D3, is an open-source JavaScript library used for visualizing data with web standards. D3 stands for Data-Driven Documents. It allows developers to bind arbitrary data to the Document Object Model (DOM) and then apply data-driven transformations to the document. This allows web developers to create dynamic, interactive data...
ZoomCharts is a feature-rich JavaScript charting library used to create interactive data visualizations for web applications and dashboards. With over 90 chart types to choose from, including line, bar, pie, map, scatter, and more, ZoomCharts provides the flexibility to represent data in a meaningful way.Some of the key capabilities and...
Koia is an open-source, self-hosted alternative to Canva's web-based graphic design platform. Like Canva, Koia provides an intuitive drag-and-drop interface and a wide range of templates and design assets to help users with no design experience easily create stunning graphics, presentations, posters, brochures, resumes, invitations and more for business, education,...
morris.js is an open-source JavaScript charting library that allows for simple creation of responsive, stylish charts and graphs. Some key features include:Light-weight and customizable architecture based on jQuery and Raphaël for cross-browser compatibilitySupports SVG, Canvas and CSS rendering for graphs and chartsOffers a variety of chart types - line, bar,...
jqPlot is an advanced open source JavaScript charting library that builds customizable charts and graphs using the jQuery JavaScript library and HTML5 canvas elements. It provides an easy way for web developers to include rich, interactive charts in their web applications and websites.Some key features of jqPlot include:Supports various chart...
AnyChart is a feature-rich JavaScript charting library that enables developers to easily add interactive charts and dashboards to web and mobile applications. With its lightweight architecture, AnyChart aims to provide high performance chart rendering optimized even for large datasets.AnyChart supports over 80 chart types including column, bar, line, area, pie,...