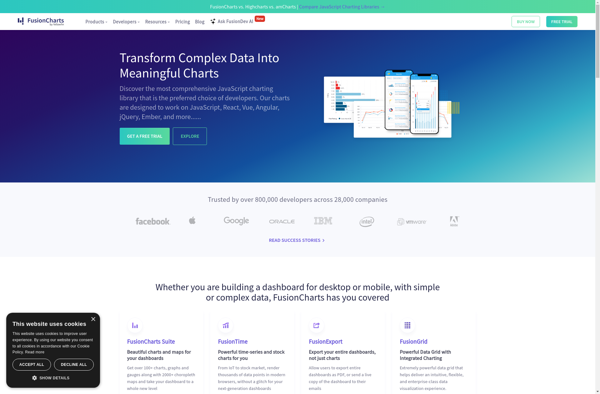
FusionCharts Suite XT is a JavaScript charting library that offers over 90 chart types and 1100 maps. It allows creating interactive JavaScript charts, gauges, heatmaps and maps for web and mobile applications.
FusionCharts Suite XT is a JavaScript charting library that offers over 90 chart types and 1100 maps. It allows creating interactive JavaScript charts, gauges, heatmaps and maps for web and mobile applications.
What is FusionCharts Suite XT?
FusionCharts Suite XT is a comprehensive JavaScript charting solution that offers over 90 chart types including column, bar, pie, line, area, scatter, bubble charts and more. It also includes over 1100 maps including choropleth, markers, routes and more.
Some key features of FusionCharts Suite XT:
Interactive JavaScript charts, gauges and maps for web and mobile apps
90+ chart types and 1100+ maps
Animated charts and real-time chart updates
Drill-down to details from chart data points
Customizable chart cosmetics and configurations
APIs for integration with various JavaScript frameworks like React, Angular, jQuery etc.
Export charts as images or PDF documents
Plot charts from CSV, JSON and XML data sources
And more...
FusionCharts Suite XT allows developers to create visually appealing, interactive charts, gauges, heatmaps and maps using simple JavaScript and JSON, without needing expertise in data visualization. It is integrated across various platforms and frameworks making it easy to add data visualization to any web or mobile app.
FusionCharts Suite XT Features
Features
90+ chart types including bar charts, pie charts, line charts, scatter plots, heat maps, gauges etc
1100+ maps including choropleth, markers, bubbles, routes and more
Animations, drill-down, real-time updates
APIs for React, Angular, jQuery, PHP, .NET, Java, Node.js
Export charts as images and PDFs
Create dashboards with multiple charts
Pricing
Free
Subscription-Based
Pros
Huge variety of chart types and customization options
Interactive and animated charts
Easy integration with various frameworks and platforms
Many Eyes is a public web application launched in 2007 by IBM Research for visualizing data and creating interactive visualizations. It allows users to upload datasets in various formats, create visualizations like charts, graphs, maps, networks and trees based on the data, and publish them for public viewing and analysis.Some...
Atlas charts is a data visualization and business intelligence software that provides an alternative to Tableau. It allows users to create interactive JavaScript charts, dashboards, and reports for data analysis and visualizations. Some key features of Atlas charts include:Drag and drop interface to build charts and dashboards quickly without codingSupport...
Statpedia is a comprehensive online resource for statistics and probability concepts. It features a searchable glossary with over 1,000 clear and concise definitions for statistical terminology along with relevant examples. Topics covered range from the basics of statistics like mean, median, mode, and standard deviation all the way to more...
Chartico is a cloud-based data visualization and business intelligence software that allows users to easily create interactive charts, dashboards and reports from their data. Some key features of Chartico include:Drag-and-drop interface to build charts, dashboards and reports visually without codingConnect to data from SQL, MongoDB, Excel, CSVs and other sources...
DataHero is a cloud-based business intelligence and analytics platform targeted at non-technical business users. It aims to make BI and data analytics accessible without needing expertise in data science or coding.Key capabilities and benefits of DataHero include:Intuitive drag-and-drop interface to build interactive dashboards and reports visualizing key business metricsConnectors to...
CiCiUI Chart is a feature-rich JavaScript charting library built on HTML5 Canvas element. It allows developers to easily create highly customizable, interactive charts and graphs and embed them into web pages and applications.Some key features and capabilities of CiCiUI Chart include:Supports a wide variety of chart types out of the...
Chart Templates is charting software that provides a library of pre-designed chart and graph templates that can be customized to visualize data. It helps non-designers easily create professional, on-brand data visualizations for business uses.The software includes hundreds of templates for all types of charts - from basic bar, lines and...