GGobi

GGobi

GGobi is an open-source data visualization software used for interactive exploratory data analysis. It allows users to visualize high-dimensional datasets with scatterplots, parallel plots, tours, and dimension reduction methods like principal components analysis and grand tours.
GGobi image
data-visualization exploratory-analysis highdimensional-data scatterplots tours

GGobi: Open-Source Data Visualization Software

Interactive exploratory data analysis tool for high-dimensional datasets with scatterplots, parallel plots, tours, dimension reduction methods & more

What is GGobi?

GGobi is an open-source, multi-platform software application for interactive exploratory data analysis. It allows users to visualize high-dimensional datasets by leveraging interactive graphics such as scatterplots, parallel coordinates, star glyphs, time series plots, tours (animation sequences for exploring n-dimensional data spaces), as well as dimension reduction techniques like principal components analysis (PCA) and grand tours.

Some key features of GGobi include:

  • Interactive, dynamic graphics for multivariate data visualization
  • Linked plots where changes made in one plot are reflected across other plots
  • Powerful data transformations like binning, scaling, jittering
  • Smoothing and density estimation
  • Identification of outliers
  • Missing value, weighted observation and variable weighting support
  • Extensible architecture to incorporate new displays and data transformations

GGobi is implemented in C++ and uses GTK+ for its graphical user interface. It can handle large datasets with hundreds of thousands of observations and over a hundred variables. GGobi runs on Linux, Mac and Windows platforms and the source code is freely available under the BSD open source license.

Overall, GGobi allows flexible interactive exploration of high-dimensional datasets to gain insight into patterns and relationships in the data through its suite of multivariate visualization methods.

GGobi Features

Features

  1. Interactive and dynamic graphics
  2. Linked, coordinated views
  3. Grand tours
  4. Projection pursuit
  5. Dimension reduction methods like PCA
  6. Brushing and identification
  7. Glyphs

Pricing

  • Open Source

Pros

Open source and free

Powerful and flexible visualization capabilities

Allows exploration of high-dimensional datasets

Linked, coordinated views make it easy to explore relationships

Support for large datasets

Cons

Steep learning curve

Limited documentation and support

Development seems to have stalled in recent years

Some stability issues

Lacks features of newer visualization tools


The Best GGobi Alternatives

Top Data Visualization and Exploratory Data Analysis and other similar apps like GGobi


Tableau icon

Tableau

Tableau is a leading business intelligence and data visualization platform used by organizations of all sizes to transform their data into easy-to-understand visualizations and dashboards. With Tableau, users can connect to a wide range of data sources, prepare and clean the data for analysis, and create interactive data visualizations such...
Tableau image
Plotly icon

Plotly

Plotly is an open-source graphing library that allows users to create interactive, publication-quality graphs, charts, and dashboards. It supports Python, R, JavaScript, and Excel as programming languages. Some key features of Plotly include:Interactive visualization - Plotly charts are interactive with features like hover text, zooming, panning, selectable legends, and editable...
Plotly image
AnswerMiner icon

AnswerMiner

AnswerMiner is an artificial intelligence-powered software that helps companies improve their customer support operations and experiences. It analyzes large volumes of customer service conversation data, including emails, chat transcripts, and call center notes, to provide actionable insights.The key features and benefits of AnswerMiner include:Understanding Frequent Customer Questions and Pain Points:...
AnswerMiner image
Paraview icon

Paraview

ParaView is an open-source, multi-platform application designed for interactive, scientific visualization. It has a client-server architecture to facilitate remote visualization of datasets, and generates level of detail (LOD) models to maintain interactive frame rates for large datasets. ParaView enables qualitative and quantitative techniques such as volume rendering, cutting planes, streamlines...
Paraview image
NVD3 icon

NVD3

NVD3 is an open-source JavaScript charting library used to build interactive data visualizations in web browsers. It is based on D3.js and reuses parts of the D3 codebase to create reusable charts. NVD3 aims to simplify and streamline D3 code for faster web development.Some key features of NVD3 include:Over a...
NVD3 image
Vega Voyager icon

Vega Voyager

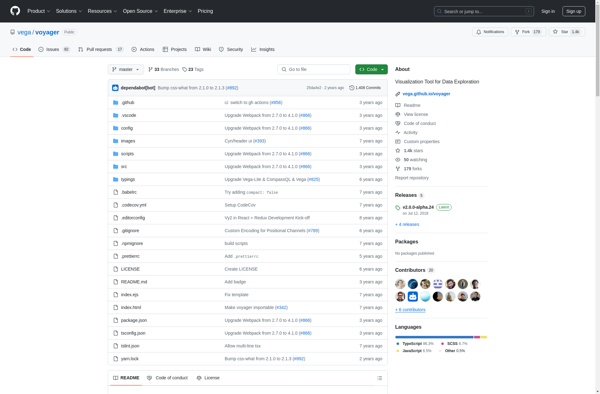
Vega Voyager is an open-source data visualization tool developed by the University of Washington Interactive Data Lab. It provides a user-friendly graphical interface for rapidly creating custom interactive visualizations from tabular dataset inputs without writing any code.With Vega Voyager, users can simply drag-and-drop their dataset and select desired visualization types...
Vega Voyager image
Stagraph icon

Stagraph

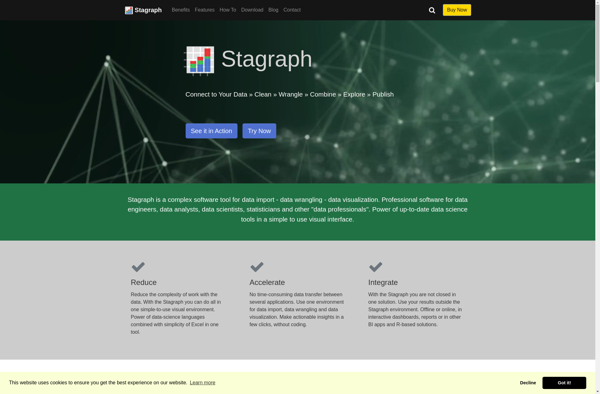
Stagraph is a powerful yet easy-to-use data visualization and analytics platform designed for modern business needs. As a cloud-based solution, Stagraph enables users to effortlessly map, analyze, and gain actionable insights from even the most complex data sets through intuitive drag-and-drop visualizations.Key capabilities and benefits include:Intelligible and interactive data visualizations...
Stagraph image
Bipp Analytics icon

Bipp Analytics

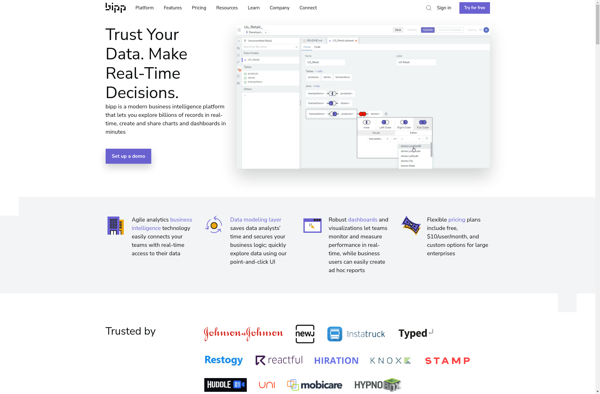
bipp Analytics is a business intelligence and data visualization software that empowers users to connect their data, analyze it visually, and extract meaningful insights. Some key features of bipp Analytics include:Data Connectors - Connect your data from databases, cloud apps, Excel, etc. with pre-built connectors.Interactive Dashboards - Build visually appealing,...
Bipp Analytics image