Paraview

Paraview

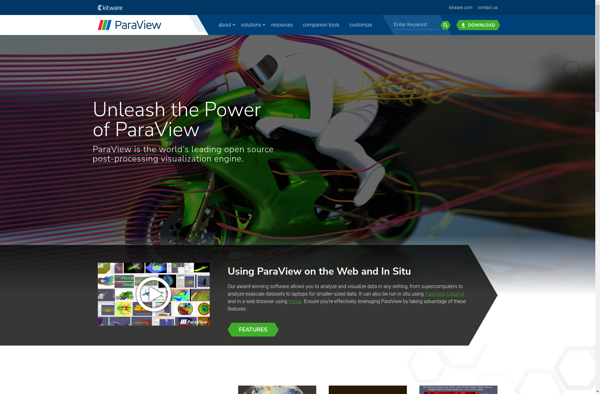
ParaView is an open-source, multi-platform data analysis and visualization application. It allows users to quickly build visualizations to analyze datasets using qualitative and quantitative techniques. The graphical user interface supports interactive visual exploration and the
Paraview image
visualization data-analysis 3d-rendering

ParaView: Open-Source Data Analysis & Visualization Tool

An open-source, multi-platform data analysis and visualization application for interactive exploration and creating basic filters and plots.

What is Paraview?

ParaView is an open-source, multi-platform application designed for interactive, scientific visualization. It has a client-server architecture to facilitate remote visualization of datasets, and generates level of detail (LOD) models to maintain interactive frame rates for large datasets. ParaView enables qualitative and quantitative techniques such as volume rendering, cutting planes, streamlines generation, histogram calculation among many others.

Some key features and capabilities of ParaView include:

  • Support for extremely large datasets through distributed processing and rendering
  • Plugin architecture to add new filters, readers and writers
  • Cinema framework for playback of visualization results
  • Python programmability to create new visualization pipelines and controls
  • Advanced rendering techniques like volume rendering, shadows and anti-aliasing
  • Time series data analysis

ParaView can connect to databases and file formats like JPEG, PNG, BMP, STL, PDB, Excel, HDF5, NetCDF to load a variety of datasets. It runs on all major operating systems like Windows, Linux and Mac OS. The intuitive user interface, high-performance visualization engine and advanced capabilities have resulted in the adoption of ParaView in several application domains including physics, biomechanics, oceanography, neuroscience, climatology and more.

Paraview Features

Features

  1. 3D visualization
  2. Volume rendering
  3. Parallel processing and scaling
  4. Plugin architecture to add new algorithms and modules
  5. Large data visualization
  6. Time series data analysis
  7. Qualitative and quantitative data analysis

Pricing

  • Open Source

Pros

Free and open source

Cross-platform compatibility

Support for large and complex datasets

Powerful data analysis capabilities

Intuitive and easy to use GUI

Extensible and customizable via plugins

Good community support

Cons

Steep learning curve

Requires powerful hardware for large datasets

Limited native statistical analysis features

Exporting visualizations can be challenging


The Best Paraview Alternatives

Top Science & Engineering and Data Visualization and other similar apps like Paraview

Here are some alternatives to Paraview:

Suggest an alternative ❐

Tecplot 360 icon

Tecplot 360

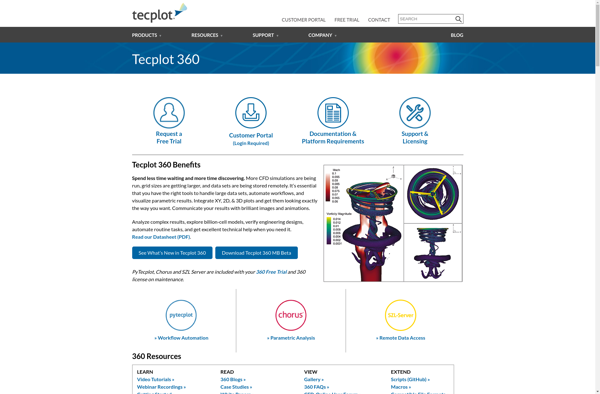
Tecplot 360 is a comprehensive data visualization and analysis solution aimed at engineers, scientists, and other technical professionals across various industries like manufacturing, energy, aerospace, automotive, etc.It allows users to import data from multiple sources including simulation output, test data, or spreadsheets. Users can then process and analyze the data...
Tecplot 360 image
Mayavi icon

Mayavi

Mayavi is an open-source, 3D scientific data visualization and plotting Python library built on top of the Visualization Toolkit (VTK) and NumPy. It provides easy and interactive workflows to visualize scalar, vector and tensor data fields in Python. Some of the key features of Mayavi include:Interactive 3D plotting of scalar...
Mayavi image
GGobi icon

GGobi

GGobi is an open-source, multi-platform software application for interactive exploratory data analysis. It allows users to visualize high-dimensional datasets by leveraging interactive graphics such as scatterplots, parallel coordinates, star glyphs, time series plots, tours (animation sequences for exploring n-dimensional data spaces), as well as dimension reduction techniques like principal components...
GGobi image
Vega Voyager icon

Vega Voyager

Vega Voyager is an open-source data visualization tool developed by the University of Washington Interactive Data Lab. It provides a user-friendly graphical interface for rapidly creating custom interactive visualizations from tabular dataset inputs without writing any code.With Vega Voyager, users can simply drag-and-drop their dataset and select desired visualization types...
Vega Voyager image
OpenDX icon

OpenDX

OpenDX is an open source software application used for visualizing, analyzing, and manipulating datasets. It is designed specifically for interactive visualization and analysis of large and complex data. Some key features and capabilities of OpenDX include:Interactive 3D volume rendering and isosurfacingAdvanced image processing and analysis toolsFlow visualization and vector field...
OpenDX image