Mayavi

Mayavi

Mayavi is an open-source, 3D scientific data visualization and plotting Python library built on top of VTK and NumPy. It provides easy ways to visualize scalar, vector and tensor data fields in Python.
Mayavi image
3d visualization plotting scientific data

Mayavi: 3D Scientific Data Visualization & Plotting

An open-source Python library for 3D data visualization and plotting built on VTK and NumPy, providing easy ways to visualize scalar, vector and tensor data fields.

What is Mayavi?

Mayavi is an open-source, 3D scientific data visualization and plotting Python library built on top of the Visualization Toolkit (VTK) and NumPy. It provides easy and interactive workflows to visualize scalar, vector and tensor data fields in Python. Some of the key features of Mayavi include:

  • Interactive 3D plotting of scalar and vector fields
  • Support for animated plots and widgets
  • Large library of visualization objects and modules
  • Scriptable visualizations using Python and NumPy
  • Extensible architecture to add new data types and algorithms
  • Integrates well with other scientific Python libraries like SciPy, Matplotlib

Mayavi relies on VTK to leverage fast 3D rendering and supports different rendering backends. It also uses NumPy to provide an interface with array data from common scientific Python libraries. Due to its simple Python workflows and rich set of visualization features, Mayavi is very popular in domains like scientific computing, medical imaging, GIS systems and education.

Mayavi Features

Features

  1. 3D scientific data visualization
  2. Volume rendering
  3. Surface plots
  4. Contour plots
  5. Vector field visualization
  6. Scalar field visualization
  7. Customizable modules

Pricing

  • Open Source

Pros

Open source

Built on VTK and NumPy

Easy to use Python API

Good performance

Wide range of visualization options

Scriptable workflows

Extendable with custom modules

Cons

Steep learning curve

Limited documentation

Not as feature rich as some commercial packages

Some stability issues

Development has slowed in recent years


The Best Mayavi Alternatives

Top Science & Engineering and Data Visualization and other similar apps like Mayavi

Here are some alternatives to Mayavi:

Suggest an alternative ❐

Paraview icon

Paraview

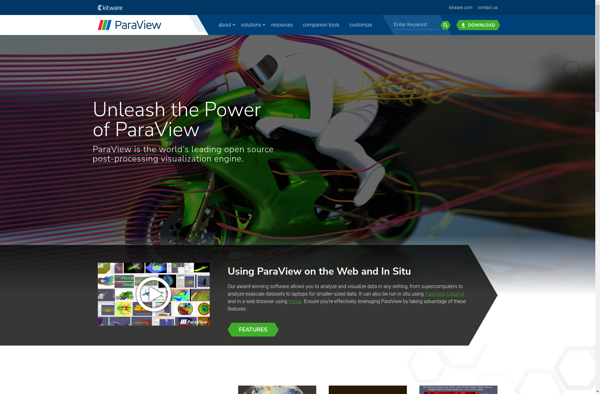
ParaView is an open-source, multi-platform application designed for interactive, scientific visualization. It has a client-server architecture to facilitate remote visualization of datasets, and generates level of detail (LOD) models to maintain interactive frame rates for large datasets. ParaView enables qualitative and quantitative techniques such as volume rendering, cutting planes, streamlines...
Paraview image
Tecplot 360 icon

Tecplot 360

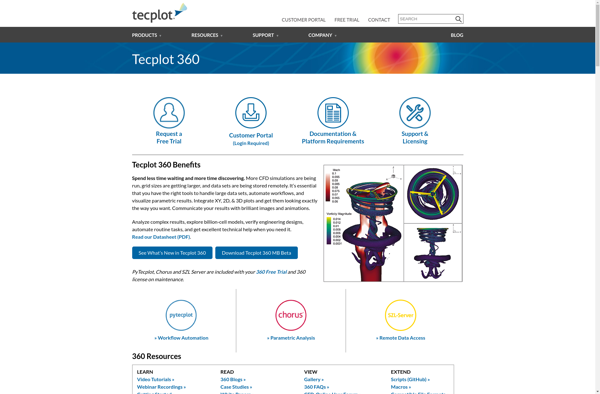
Tecplot 360 is a comprehensive data visualization and analysis solution aimed at engineers, scientists, and other technical professionals across various industries like manufacturing, energy, aerospace, automotive, etc.It allows users to import data from multiple sources including simulation output, test data, or spreadsheets. Users can then process and analyze the data...
Tecplot 360 image
OpenDX icon

OpenDX

OpenDX is an open source software application used for visualizing, analyzing, and manipulating datasets. It is designed specifically for interactive visualization and analysis of large and complex data. Some key features and capabilities of OpenDX include:Interactive 3D volume rendering and isosurfacingAdvanced image processing and analysis toolsFlow visualization and vector field...
OpenDX image