Mayavi
Description: Mayavi is an open-source, 3D scientific data visualization and plotting Python library built on top of VTK and NumPy. It provides easy ways to visualize scalar, vector and tensor data fields in Python.
Type: software
Pricing: Open Source
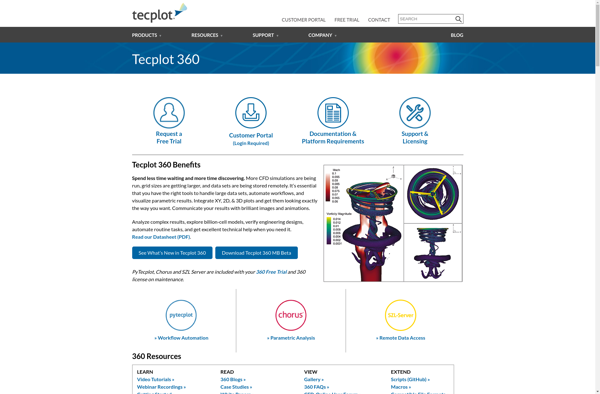
Tecplot 360
Description: Tecplot 360 is a comprehensive data visualization and analysis software for engineers and scientists. It allows importing, processing, analyzing, and visualizing technical data in 2D and 3D. Key features include interactive plotting, animations, custom analytics, and publishing.
Type: software