Tecplot 360

Tecplot 360: Comprehensive Data Visualization & Analysis Software
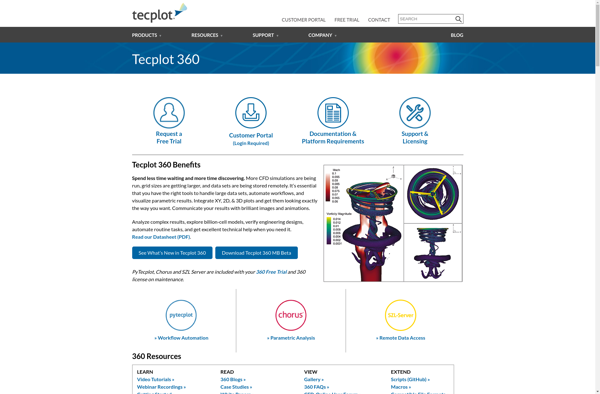
Tecplot 360 is a powerful data visualization and analysis software for engineers and scientists, offering interactive plotting, animations, custom analytics, and publishing capabilities.
What is Tecplot 360?
Tecplot 360 is a comprehensive data visualization and analysis solution aimed at engineers, scientists, and other technical professionals across various industries like manufacturing, energy, aerospace, automotive, etc.
It allows users to import data from multiple sources including simulation output, test data, or spreadsheets. Users can then process and analyze the data to gain insights. Key processing features include filtering, smoothing, interpolation, numerical analytics like derivatives and integrals etc.
The visualization capabilities of Tecplot 360 are very powerful. It makes it easy for users to create 2D and 3D plots like scatter, line, surface, volumetric, contour, vector plots etc. There are various visualization options like animations, color maps, lighting that bring out insights from the data.
Users can also add custom calculations to derive parameters of interest from the raw data for analysis. Analytics features like line probes, numerical integration, histograms, reference curves, customizable reports etc. further aid in analysis.
Finally, Tecplot 360 also enables users to save the analysis sessions and share interactive visualizations with technical and non-technical colleagues through images, videos, presentations, or web views.
Tecplot 360 Features
Features
- 2D and 3D visualization
- Interactive plotting and animations
- Import data from CAD, CFD, FEA, and other technical formats
- Process large datasets
- Customize plots with multiple axes, legends, color maps
- Analyze data with filters, slices, mathematical operations
- Custom scripting and analytics
- Batch processing and automation
- Share results through images, animations, PDF reports
Pricing
- Subscription-Based
- Pay-As-You-Go
Pros
Cons
Reviews & Ratings
Login to ReviewThe Best Tecplot 360 Alternatives
Top Science & Engineering and Data Analysis & Visualization and other similar apps like Tecplot 360
Paraview

Mayavi
