Mayavi
Description: Mayavi is an open-source, 3D scientific data visualization and plotting Python library built on top of VTK and NumPy. It provides easy ways to visualize scalar, vector and tensor data fields in Python.
Type: software
Pricing: Open Source
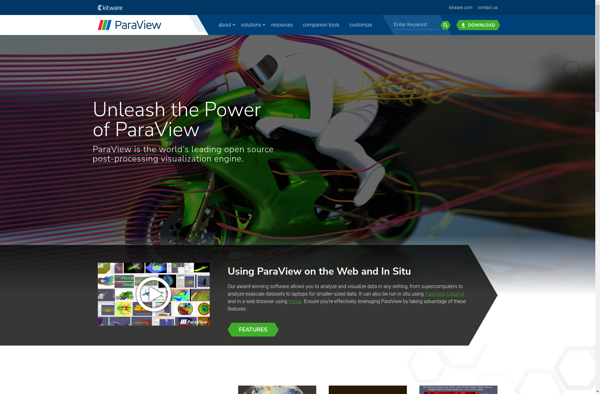
Paraview
Description: ParaView is an open-source, multi-platform data analysis and visualization application. It allows users to quickly build visualizations to analyze datasets using qualitative and quantitative techniques. The graphical user interface supports interactive visual exploration and the creation of basic filters and plots.
Type: software
Pricing: Open Source