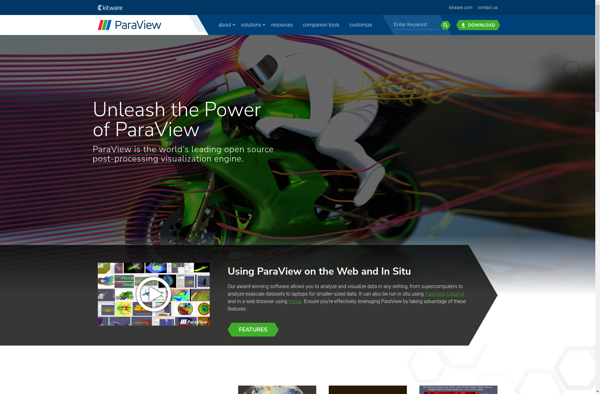
Paraview
Description: ParaView is an open-source, multi-platform data analysis and visualization application. It allows users to quickly build visualizations to analyze datasets using qualitative and quantitative techniques. The graphical user interface supports interactive visual exploration and the creation of basic filters and plots.
Type: software
Pricing: Open Source
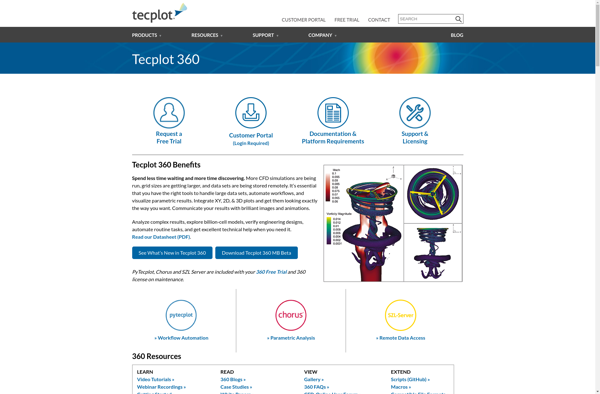
Tecplot 360
Description: Tecplot 360 is a comprehensive data visualization and analysis software for engineers and scientists. It allows importing, processing, analyzing, and visualizing technical data in 2D and 3D. Key features include interactive plotting, animations, custom analytics, and publishing.
Type: software