Vega Voyager

Vega Voyager

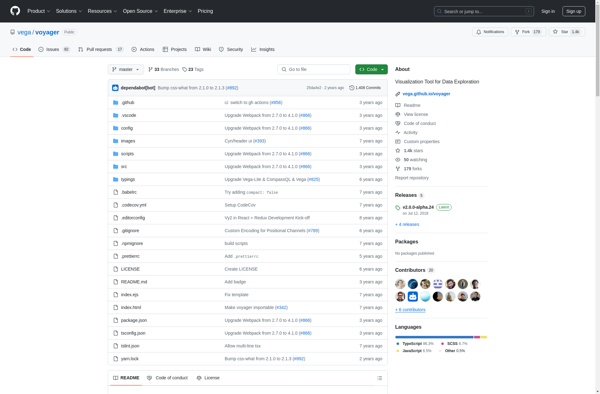
Vega Voyager is an open-source data visualization tool that allows users to create interactive data visualizations without coding. It has a simple drag-and-drop interface for building charts and graphs from datasets.
Vega Voyager image
data-visualization charts graphs draganddrop nocode

Vega Voyager: Open-Source Data Visualization Tool

An open-source data visualization tool allowing users to create interactive visualizations without coding, utilizing a simple drag-and-drop interface for building charts and graphs from datasets.

What is Vega Voyager?

Vega Voyager is an open-source data visualization tool developed by the University of Washington Interactive Data Lab. It provides a user-friendly graphical interface for rapidly creating custom interactive visualizations from tabular dataset inputs without writing any code.

With Vega Voyager, users can simply drag-and-drop their dataset and select desired visualization types like bar charts, line graphs, scatter plots, maps, and more. An automated recommendation system suggests effective visual encodings based on the data, allowing fast iterative visualization prototyping. Users can customize all visual aspects of the charts including colors, axes, legends, and faceting. Interactive features like panning, zooming, and tooltips can also be added.

Vega Voyager outputs customizable Vega-Lite visualization specifications that can be saved and shared with others or embedded in reports and presentations. The tool is intended for use by data analysts, scientists, journalists, and anyone wishing to create visualizations for the web quickly without coding entire visualizations from scratch.

Vega Voyager Features

Features

  1. Drag-and-drop interface for building visualizations
  2. Support for Vega and Vega-Lite grammar
  3. Built-in dataset library
  4. Shareable links
  5. Visualization publishing
  6. Chart recommendations

Pricing

  • Open Source

Pros

Easy to use for non-coders

Great for quick data exploration

Open source and free

Good documentation and community support

Cons

Limited customization compared to coding visuals

Not ideal for complex or advanced analysis

Only supports Vega data formats


The Best Vega Voyager Alternatives

Top Data Visualization and Visualization Tools and other similar apps like Vega Voyager

Here are some alternatives to Vega Voyager:

Suggest an alternative ❐

Tableau icon

Tableau

Tableau is a leading business intelligence and data visualization platform used by organizations of all sizes to transform their data into easy-to-understand visualizations and dashboards. With Tableau, users can connect to a wide range of data sources, prepare and clean the data for analysis, and create interactive data visualizations such...
Tableau image
AnswerMiner icon

AnswerMiner

AnswerMiner is an artificial intelligence-powered software that helps companies improve their customer support operations and experiences. It analyzes large volumes of customer service conversation data, including emails, chat transcripts, and call center notes, to provide actionable insights.The key features and benefits of AnswerMiner include:Understanding Frequent Customer Questions and Pain Points:...
AnswerMiner image
Paraview icon

Paraview

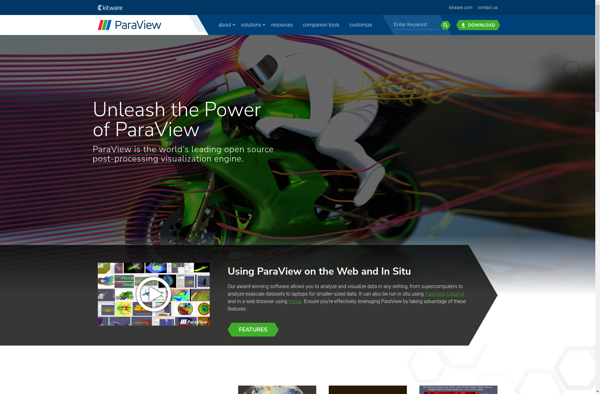
ParaView is an open-source, multi-platform application designed for interactive, scientific visualization. It has a client-server architecture to facilitate remote visualization of datasets, and generates level of detail (LOD) models to maintain interactive frame rates for large datasets. ParaView enables qualitative and quantitative techniques such as volume rendering, cutting planes, streamlines...
Paraview image
GGobi icon

GGobi

GGobi is an open-source, multi-platform software application for interactive exploratory data analysis. It allows users to visualize high-dimensional datasets by leveraging interactive graphics such as scatterplots, parallel coordinates, star glyphs, time series plots, tours (animation sequences for exploring n-dimensional data spaces), as well as dimension reduction techniques like principal components...
GGobi image