Vega-Lite

Vega-Lite

Vega-Lite is a high-level grammar for visualizations that generates complete Vega specifications. It provides a concise JSON syntax for rapidly creating visualizations to explore and analyze data sets. Vega-Lite specifications can be compiled to Vega specifications to generate in
Vega-Lite image
visualization vega grammar graphics charting

Vega-Lite: High-Level Grammar for Visualizations

Vega-Lite is a high-level grammar for visualizations that generates complete Vega specifications. It provides a concise JSON syntax for rapidly creating visualizations to explore and analyze data sets. Vega-Lite specifications can be compiled to Vega specifications to generate interactive views.

What is Vega-Lite?

Vega-Lite is a high-level visualization grammar built on top of the Vega visualization grammar. It provides a concise, human-readable JSON syntax for creating visualizations by specifying mappings from data fields to visual channels such as x, y, color, and size.

Some key capabilities and benefits of Vega-Lite include:

  • Rapid generation of visualizations with small code. Vega-Lite specifications are typically less than 100 lines of JSON.
  • In-depth customization while keeping specs concise. Vega-Lite supports many types of customization for common use cases.
  • Composition of visualizations. Multiple Vega-Lite graphs can be composed together into dashboards and multi-view displays.
  • Generation of declarative visualization specifications. Vega-Lite specs declare what the visualization should show rather than how to achieve it.
  • Publishing and sharing. Vega-Lite graphs can be readily shared, embedded online, and exported as image files.

Vega-Lite specifications are compiled to full Vega specs, which are then parsed and executed using Vega to render interactive views. This provides both high-level declarative syntax and lower-level access for customization.

Overall, Vega-Lite makes it much easier to build production-ready, customizable, publishable exploratory visualizations on top of Vega compared to using the lower-level Vega spec alone.

Vega-Lite Features

Features

  1. Declarative JSON grammar
  2. Automatic visualization design
  3. Interactions and animations
  4. Composition
  5. Reactive updates
  6. Publish and share

Pricing

  • Open Source

Pros

Concise and human-readable

Great for rapid iterative design

Built-in interactivity

Easily extendable and customizable

Cons

Less flexible than full Vega

Limited set of visualizations

Steep learning curve


The Best Vega-Lite Alternatives

Top Data Visualization and Grammar Of Graphics and other similar apps like Vega-Lite


D3.js icon

D3.js

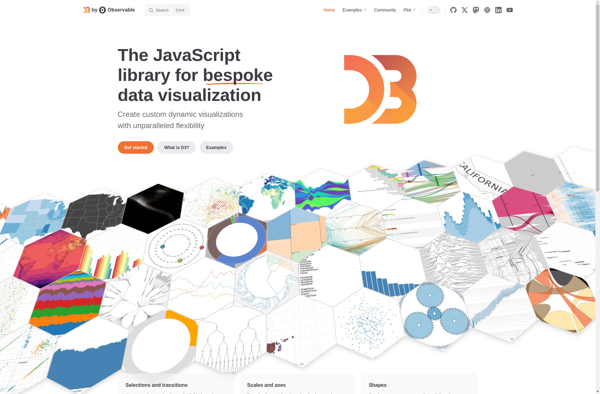
D3.js, or D3, is an open-source JavaScript library used for visualizing data with web standards. D3 stands for Data-Driven Documents. It allows developers to bind arbitrary data to the Document Object Model (DOM) and then apply data-driven transformations to the document. This allows web developers to create dynamic, interactive data...
D3.js image
C3.js icon

C3.js

C3.js is an open-source JavaScript library for generating clear and attractive charts. It is a wrapper built on top of D3.js that simplifies common chart types like line, bar, pie, scatter, stacked graphs, etc. The goal is to provide an easy way for web developers to visualize data without writing...
C3.js image
NVD3 icon

NVD3

NVD3 is an open-source JavaScript charting library used to build interactive data visualizations in web browsers. It is based on D3.js and reuses parts of the D3 codebase to create reusable charts. NVD3 aims to simplify and streamline D3 code for faster web development.Some key features of NVD3 include:Over a...
NVD3 image
Bokeh icon

Bokeh

Bokeh is an open-source Python library for creating interactive data visualizations for modern web browsers. It allows users to quickly construct versatile and high-performance graphics from simple plots to complex dashboards. Some key features of Bokeh include:Integration with common Python data science libraries like NumPy, Pandas, Scikit-Learn for easy data...
Bokeh image
Picasso.js icon

Picasso.js

Picasso.js is an open-source JavaScript charting library built on top of the HTML5 Canvas element. It provides a simple yet powerful API for easily creating rich and interactive data visualizations and charts in the browser.Some of the key features of Picasso.js include:Supports a wide variety of chart types out of...
Picasso.js image
Vega Visualization Grammar icon

Vega Visualization Grammar

Vega is an open-source visualization grammar developed by the University of Washington Interactive Data Lab. It provides a JSON-based declarative format for creating, saving, and sharing interactive visualization designs.Some key features of Vega include:Declarative visualization specification format to concisely describe visualizationsBuilt-in support for various graphical encoding and interaction techniques like...
Vega Visualization Grammar image