GraphUp is a data visualization and analytics software that allows users to easily create interactive charts, graphs, and dashboards to visualize complex data. It has a user-friendly drag and drop interface to build visualizations quickly without coding.
GraphUp: Data Visualization and Analytics Software
GraphUp is a data visualization and analytics software that allows users to easily create interactive charts, graphs, and dashboards to visualize complex data. It has a user-friendly drag and drop interface to build visualizations quickly without coding.
What is GraphUp?
GraphUp is a powerful yet easy-to-use data visualization and analytics software suitable for business users of all backgrounds. With an intuitive drag-and-drop interface, GraphUp makes it simple to connect to data sources, build interactive charts and dashboards, and share analytics and insights with others.
Key features of GraphUp include:
Flexible drag-and-drop interface to instantly visualize data from CSV, Excel, databases and other sources
Vast library of customizable chart and graph types including bar, pie, line, scatter, maps, heatmaps and more
Interactive dashboards to combine multiple visuals into a single pane of glass
Collaboration tools to share and discuss analytics with team members
Scheduled reports and alerts when metrics cross thresholds
APIs and integrations with popular business apps like Salesforce
Top-notch security and governance around data access and permissions
With its excellent balance of ease-of-use and enterprise-grade governance, GraphUp is the ideal data visualization solution for finance, marketing, operations, HR and IT users who want self-service access to analytics without relying on developers or data scientists.
GraphUp Features
Features
Drag-and-drop interface to create charts/graphs quickly
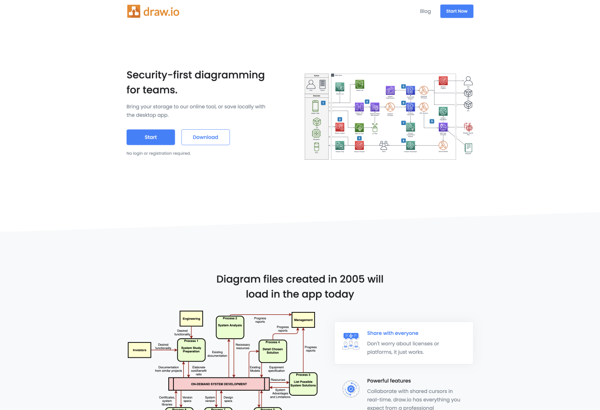
draw.io is a feature-rich diagramming and flowchart software that runs in your web browser. As a freemium tool, draw.io offers a free basic version as well as paid plans with more functionality for professionals and teams.With an intuitive drag-and-drop interface and built-in shape libraries, draw.io makes it easy for anyone...
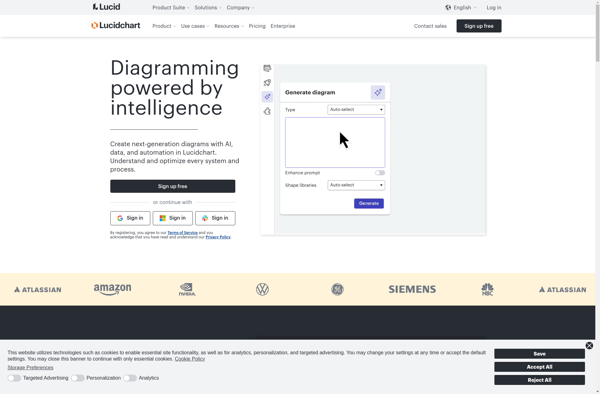
Lucidchart is a cloud-based diagramming application that allows users to collaborate and share diagrams in real time. It is used by over 30 million users and integrates with popular applications like Google Workspace, Microsoft Office 365, Confluence, and Jira.With an intuitive drag-and-drop interface, Lucidchart makes it easy for anyone to...
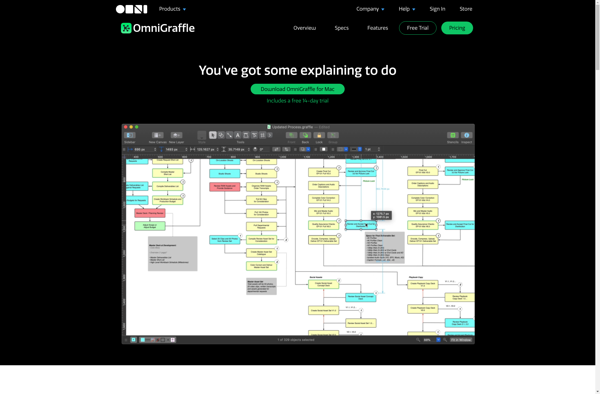
OmniGraffle is a powerful, versatile diagramming application developed by The Omni Group for macOS and iOS. First released in 2001, OmniGraffle enables users to create a wide range of diagrams, charts, illustrations, and graphic documents.With an intuitive and flexible interface, OmniGraffle makes it easy to quickly map out concepts, ideas,...
PlantUML is an open-source tool used for rapidly creating UML diagrams from a plain text language. It supports all standard UML diagrams like use case diagrams, component diagrams, class diagrams, sequence diagrams, state diagrams, activity diagrams, etc. The main goal of PlantUML is to provide a simple and efficient way...
Google Drawings is a free online diagramming and charting tool offered by Google as part of its Google Workspace productivity suite. It allows users to create flowcharts, organizational charts, mind maps, concept maps, site maps, and other types of diagrams.Some key features of Google Drawings include:Intuitive drag-and-drop interface for easily...
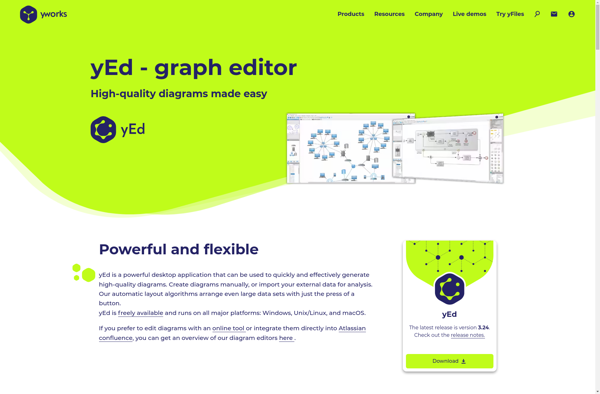
yEd Graph Editor is a free, powerful desktop application for Windows, macOS and Linux that can be used to quickly and easily create diagrams. It supports a wide range of diagram types including flowcharts, network diagrams, UML diagrams, BPMN diagrams, mind maps, organization charts, and more.Some key features of yEd...
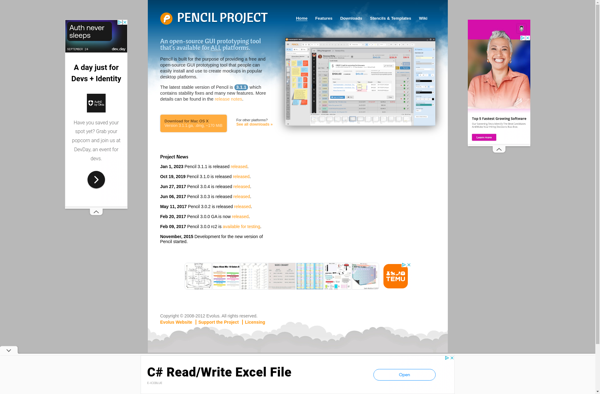
Pencil Project is a free and open source tool for creating GUI prototypes and mockups for applications and websites. It allows users to rapidly create wireframes and prototypes to visualize designs and layout concepts without any programming knowledge.Key features of Pencil Project include:An easy-to-use graphical interface for quick mockup generationTools...
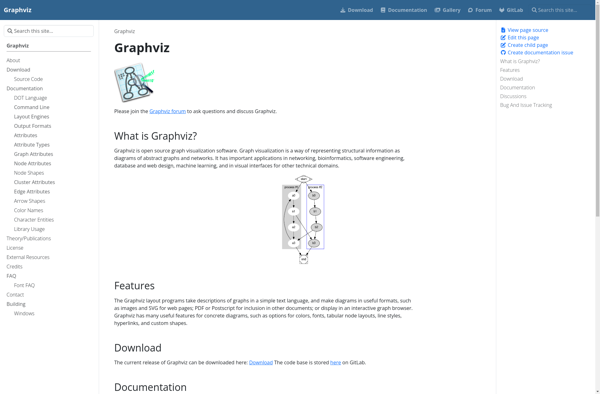
Graphviz is an open-source graph visualization software package developed by AT&T; Research. It is used for representing structural information as diagrams of abstract graphs and networks.Graphviz allows users to create a variety of graph and network types, including directed graphs, undirected graphs, hierarchies, and more. Some of the key features...
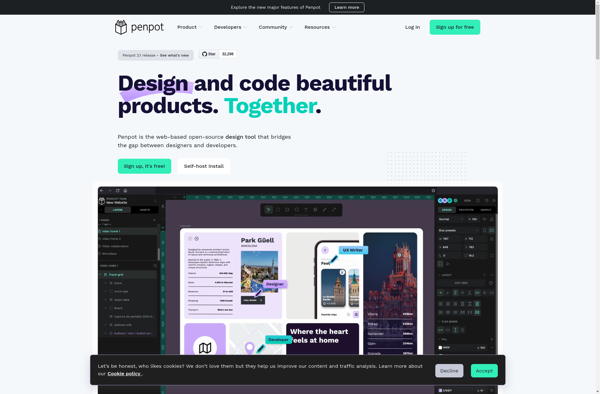
Penpot is a versatile open source design and prototyping tool built specifically for UI and UX designers. It combines design capabilities like vectors, symbols, and canvas grids with prototyping features for interaction flows, animations, and component libraries to make it easy to create beautiful designs and hi-fidelity prototypes. Some of...
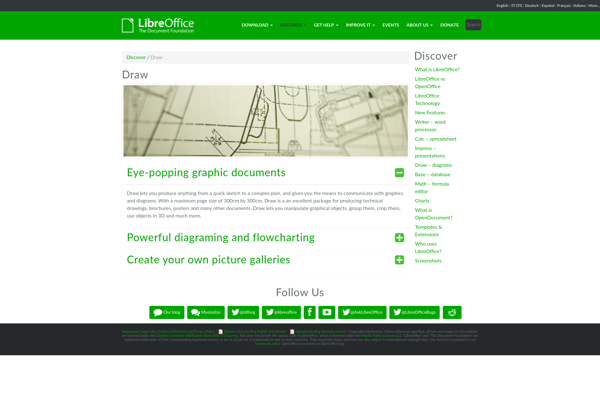
LibreOffice Draw is a vector graphics editor included in the open source LibreOffice software suite. It allows users to create a wide variety of graphical images including diagrams, flowcharts, organizational charts, network layouts, floor plans, and more.As an open source alternative to Microsoft Visio, LibreOffice Draw provides many similar features...
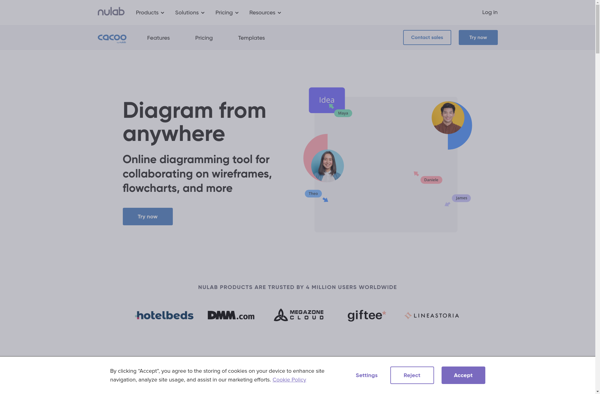
Cacoo is an intuitive and flexible online diagramming tool used by teams worldwide. It enables users to visually collaborate and communicate complex information and processes through flowcharts, wireframes, UML diagrams, network topology maps, and more.Some key features of Cacoo include:Drag-and-drop interface that makes diagramming intuitiveLarge library of templates and shapesReal-time...