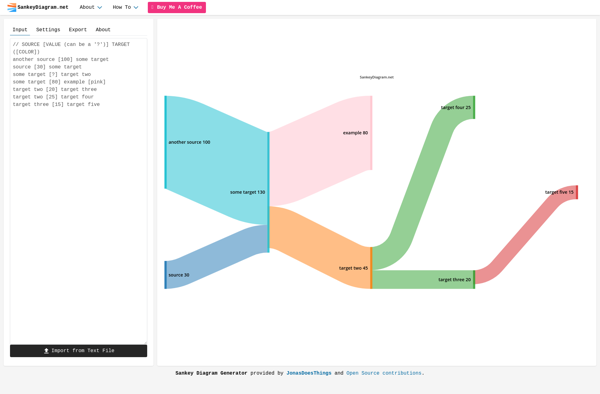
SankeyDiagram.net is a free online tool to easily create Sankey diagrams. It allows users to visually map flows between different entities with customizable nodes and links. The interface is intuitive and does not require registration.
Create intuitive Sankey diagrams without registration, customize nodes and links for visual flow mapping, a free online tool for easy data representation.
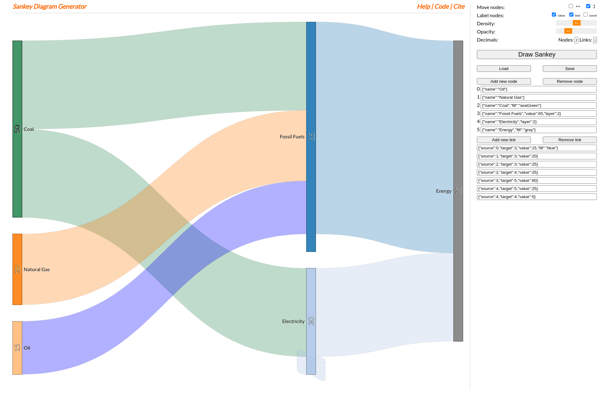
What is SankeyDiagram.net?
SankeyDiagram.net is a free online application that allows users to easily create Sankey diagrams without the need to download or install any software. Sankey diagrams are a type of flow diagram that visualizes quantitative flows between different entities through proportional arrows.
Some key features of SankeyDiagram.net:
Intuitive drag and drop interface to add nodes and links between them
Customizable nodes and links with options to change colors, add labels, set widths etc.
Ability to create complex diagrams with multiple hierarchical levels
No need to register or login to start using the tool
Diagrams can be exported as PNG images or SVG files
Mobile responsive interface
Completely free to use with no restrictions
With its easy-to-use interface and flexible customization options, SankeyDiagram.net is a great choice for anyone looking to visualize flows and processes through Sankey diagrams without the overhead of installing and learning complex software.
Ultimate Dashboard Tools is a powerful WordPress plugin that enables you to create custom dashboards for your WordPress site. With its drag-and-drop interface, you can easily build dashboards tailored to your needs without any coding required.Some key features of Ultimate Dashboard Tools include:Over 50 customizable widgets covering analytics, sales, social...
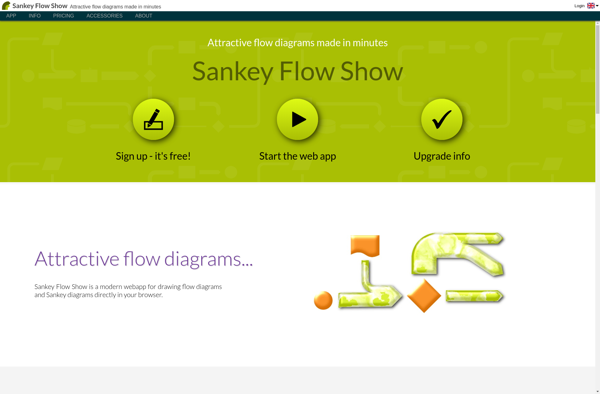
Sankey Flow Show is a free online tool used to create Sankey diagrams that visualize flows and connections between elements in a system. It offers an intuitive drag-and-drop interface to quickly map relationships and proportional flows between factors and events.Some key features of Sankey Flow Show include:Simple and easy-to-use graphical...
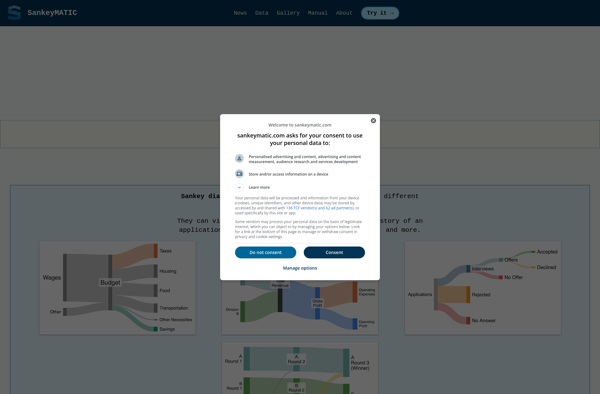
SankeyMATIC is a free online application that allows users to easily create Sankey diagrams. Sankey diagrams are a specific type of flow diagram that visualize the flows and quantities between different variables in a system.Some key features of SankeyMATIC include:Intuitive drag-and-drop interface for constructing diagramsOptions for customizing diagram appearance including...
Sankey diagrams are a specialized type of flow diagram that visualize the transfers or flows within a system. They are especially useful for highlighting major flows of materials, energy, or money between processes or entities. The thicker the arrow in a Sankey diagram, the larger the flow quantity.These diagrams are...
Sankey diagram generators are online tools that allow users to create Sankey diagrams with ease. Sankey diagrams visualize the directed flows between nodes in a system. They are especially useful for depicting flows in a process, such as tracing energy transfers, material flows, or expenditures between different states of a...
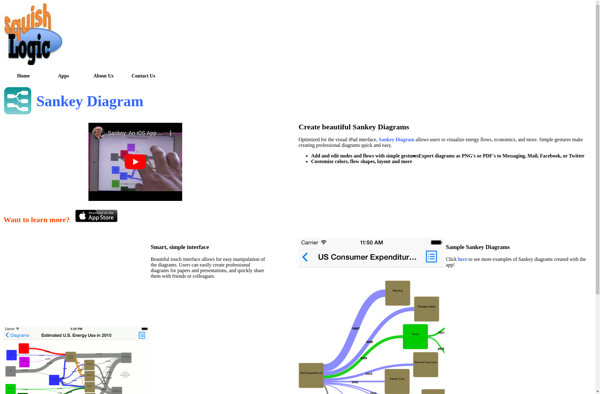
Sankey Diagram (csaladen) is a free, open-source web application designed specifically for creating sankey diagrams. Sankey diagrams visualize flow or transfer between nodes through proportional arrows. They are especially useful for depicting energy flows, material flows, and more.Some key features of Sankey Diagram (csaladen) include:Intuitive drag and drop interface to...
e!Sankey is a free, open-source software application used to create Sankey diagrams. Sankey diagrams are a type of flow diagram often used to visualize the transfers or flows within a system. Some common uses of Sankey diagrams include showing energy flows, material flows, budget flows, or resource flows.e!Sankey provides an...
Open Sankey is an open-source software application used to create Sankey diagrams, which are visualizations used to depict complex flows and material balances in systems. Sankey diagrams feature arrows of varying widths proportional to the flow quantity they represent, allowing users to visually map quantities and proportions within systems containing...