Sankey Flow Show

Sankey Flow Show

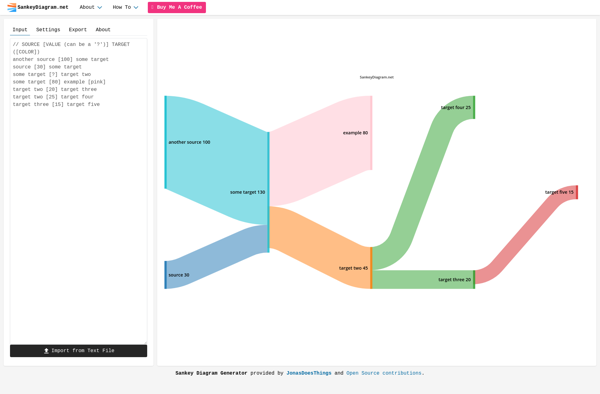
Sankey Flow Show is a free online tool to create Sankey diagrams. It allows users to visually map flows, relationships and connections between elements in a system or process. The interface is simple and intuitive to quickly build Sankey charts.
Sankey Flow Show image
sankey flow diagram data-visualization

Sankey Flow Show: Free Online Tool for Creating Sankey Diagrams

Create visual maps of flows, relationships, and connections with our free online tool - simple and intuitive interface

What is Sankey Flow Show?

Sankey Flow Show is a free online tool used to create Sankey diagrams that visualize flows and connections between elements in a system. It offers an intuitive drag-and-drop interface to quickly map relationships and proportional flows between factors and events.

Some key features of Sankey Flow Show include:

  • Simple and easy-to-use graphical interface to build Sankey charts
  • Drag-and-drop nodes and connections to design the flow diagram
  • Customize node color, size and labeling
  • Map both qualitative and quantitative relationships
  • Adjust curve bendiness and diagram layout
  • No need to register or login to start creating charts
  • Export Sankey diagrams as PNG files or embed into websites
  • Completely free to use with no restrictions

Sankey Flow Show makes it easy for anyone to create beautiful Sankey diagrams to communicate complex flows, relationships and proportional connections in network diagrams. It's ideal for use in business presentations, data visualizations, network analysis and more.

Sankey Flow Show Features

Features

  1. Create Sankey diagrams online
  2. Drag and drop interface to add nodes and connections
  3. Customize node color, size and labels
  4. Change thickness and curvature of connections
  5. Zoom, pan and fit diagram to canvas
  6. Export as PNG image or SVG file
  7. Real-time collaboration for team editing
  8. Embed or share diagrams with others

Pricing

  • Free

Pros

Free to use with no login required

Intuitive and easy to learn

Great for visualizing flows and relationships

Customizable appearance and layout

Ability to collaborate in real-time

Export diagrams in standard formats

Cons

Limited customization compared to desktop apps

No ability to import/export data

Must start diagram from scratch each time

No advanced diagramming features

Lacks some enterprise-level capabilities


The Best Sankey Flow Show Alternatives

Top Data Visualization and Flow Diagrams and other similar apps like Sankey Flow Show


Microsoft Office Visio icon

Microsoft Office Visio

Microsoft Office Visio is diagramming and vector graphics software developed by Microsoft. It is used to create a wide variety of business diagrams and visualizations including flowcharts, organizational charts, network diagrams, workflows, floorplans, and more.Key features of Visio include:Hundreds of professionally-designed templates for quick diagram creationIntuitive drag-and-drop interface to easily...
Microsoft Office Visio image
Lucidchart icon

Lucidchart

Lucidchart is a cloud-based diagramming application that allows users to collaborate and share diagrams in real time. It is used by over 30 million users and integrates with popular applications like Google Workspace, Microsoft Office 365, Confluence, and Jira.With an intuitive drag-and-drop interface, Lucidchart makes it easy for anyone to...
Lucidchart image
Gliffy icon

Gliffy

Gliffy is an online diagram and flowchart creation tool that allows users to easily visualize ideas, concepts, systems, and processes. With an intuitive drag-and-drop interface and a large library of templates, examples, and symbols, Gliffy makes it simple to create flowcharts, network diagrams, UML diagrams, floor plans, user interface designs,...
Gliffy image
SankeyMATIC icon

SankeyMATIC

SankeyMATIC is a free online application that allows users to easily create Sankey diagrams. Sankey diagrams are a specific type of flow diagram that visualize the flows and quantities between different variables in a system.Some key features of SankeyMATIC include:Intuitive drag-and-drop interface for constructing diagramsOptions for customizing diagram appearance including...
SankeyMATIC image
Sankey Diagram icon

Sankey Diagram

Sankey diagrams are a specialized type of flow diagram that visualize the transfers or flows within a system. They are especially useful for highlighting major flows of materials, energy, or money between processes or entities. The thicker the arrow in a Sankey diagram, the larger the flow quantity.These diagrams are...
Sankey Diagram image
Sankey Diagram Generator icon

Sankey Diagram Generator

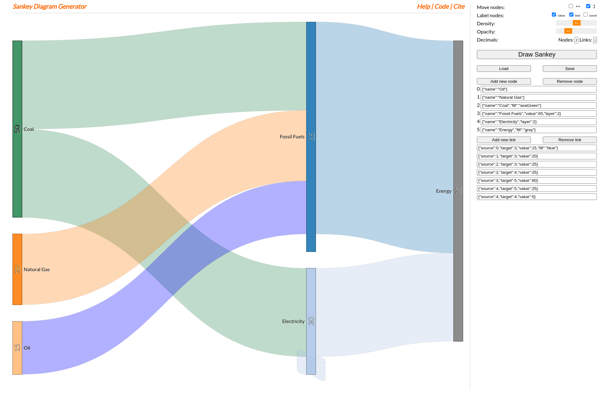
Sankey diagram generators are online tools that allow users to create Sankey diagrams with ease. Sankey diagrams visualize the directed flows between nodes in a system. They are especially useful for depicting flows in a process, such as tracing energy transfers, material flows, or expenditures between different states of a...
Sankey Diagram (csaladen) icon

Sankey Diagram (csaladen)

Sankey Diagram (csaladen) is a free, open-source web application designed specifically for creating sankey diagrams. Sankey diagrams visualize flow or transfer between nodes through proportional arrows. They are especially useful for depicting energy flows, material flows, and more.Some key features of Sankey Diagram (csaladen) include:Intuitive drag and drop interface to...
Sankey Diagram (csaladen) image
E!Sankey icon

E!Sankey

e!Sankey is a free, open-source software application used to create Sankey diagrams. Sankey diagrams are a type of flow diagram often used to visualize the transfers or flows within a system. Some common uses of Sankey diagrams include showing energy flows, material flows, budget flows, or resource flows.e!Sankey provides an...
E!Sankey image
SankeyDiagram.net icon

SankeyDiagram.net

SankeyDiagram.net is a free online application that allows users to easily create Sankey diagrams without the need to download or install any software. Sankey diagrams are a type of flow diagram that visualizes quantitative flows between different entities through proportional arrows.Some key features of SankeyDiagram.net:Intuitive drag and drop interface to...
SankeyDiagram.net image
Open Sankey icon

Open Sankey

Open Sankey is an open-source software application used to create Sankey diagrams, which are visualizations used to depict complex flows and material balances in systems. Sankey diagrams feature arrows of varying widths proportional to the flow quantity they represent, allowing users to visually map quantities and proportions within systems containing...
Open Sankey image
Merge Plan icon

Merge Plan

Merge Plan is a cloud-based project management and team collaboration software designed specifically for creative agencies, consulting firms, architectural firms, advertising agencies, design studios, and other professional services organizations. It provides a simple yet powerful way for service teams to plan projects, manage client requests, track progress with tasks and...
Merge Plan image
WikiBudgets icon

WikiBudgets

wikiBudgets is a free, open-source web-based personal budgeting and finance tracking application. It provides a user-friendly interface for individuals and households to track their full financial picture, including income, spending, account balances, savings goals, investments, debts, and net worth over time.Some key features of wikiBudgets include:Creating customizable budgets and categories...
WikiBudgets image