Sankey Diagram

Sankey Diagram: Visualize Materials Flow
Discover Sankey diagrams, a type of flow diagram that illustrates material or energy flow, showcasing inputs, outputs, and efficiencies, all in one visual representation.
What is Sankey Diagram?
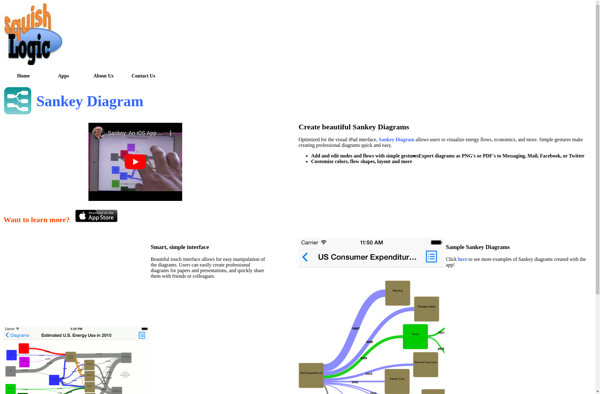
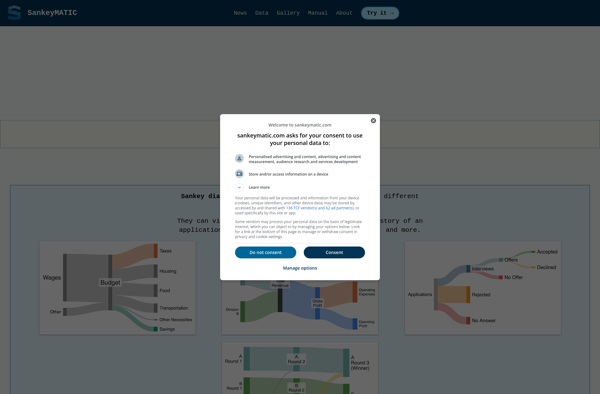
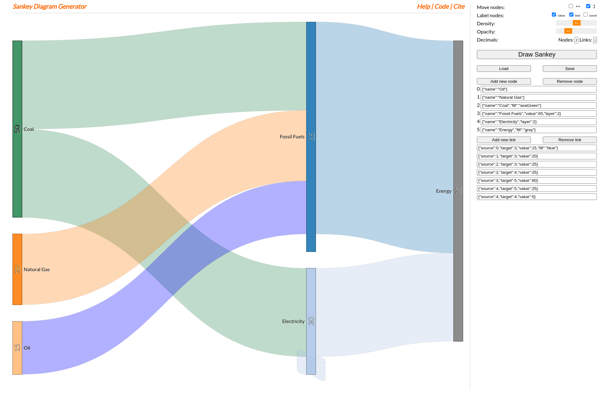
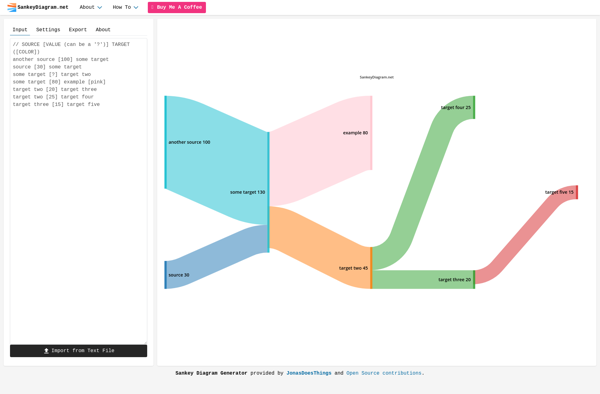
Sankey diagrams are a specialized type of flow diagram that visualize the transfers or flows within a system. They are especially useful for highlighting major flows of materials, energy, or money between processes or entities. The thicker the arrow in a Sankey diagram, the larger the flow quantity.
These diagrams are named after Irish Captain Matthew Henry Phineas Riall Sankey, who used this type of diagram in 1898 to visualize energy flows during a steam engine efficiency evaluation. Since then, Sankey diagrams have become popular visualization tools in fields such as industrial processes, product life cycles assessments, energy systems modeling, and material flow analysis.
Unlike basic flow charts, Sankey diagrams allow viewers to quickly visualize key material flows and losses within a process. The arrow widths are shown proportionally to the flow quantity. This allows for quick visual assessment of major flows and losses, inefficient areas, recycling loops, waste products etc. Users can set source inputs on the left and desired outputs on the right and trace flows in between to optimize processes. They are especially useful for highlighting energy/resource losses and areas for efficiency gains.
While historically used for steam engines and industrial processes, Sankey diagrams today are widely used for visualizing energy systems, life cycle analyses, supply chains, product manufacturing plans and material use. They help model flows to minimize waste. Some common software programs used to generate these diagrams are: STAN, e!Sankey and SankeyEditor.
Sankey Diagram Features
Features
- Create and customize Sankey diagrams
- Visualize flow of materials, energy, or value
- Illustrate inputs, outputs, and efficiencies
- Export diagrams to various file formats
- Collaborate and share diagrams with others
Pricing
- Free
- Subscription-Based
Pros
Cons
Official Links
Reviews & Ratings
Login to ReviewThe Best Sankey Diagram Alternatives
Top Data Visualization and Flow Diagrams and other similar apps like Sankey Diagram
Sankey Flow Show

SankeyMATIC

Sankey Diagram Generator
Sankey Diagram (csaladen)

E!Sankey

SankeyDiagram.net

Open Sankey

WikiBudgets
