Ultimate Dashboard Tools is a WordPress plugin that allows you to create custom dashboards for your website. It includes widgets, themes, and templates to help you build dashboards for analytics, sales, project management, and more.
Ultimate Dashboard Tools is a WordPress plugin that allows you to create custom dashboards for your website. It includes widgets, themes, and templates to help you build dashboards for analytics, sales, project management, and more.
What is Ultimate Dashboard Tools?
Ultimate Dashboard Tools is a powerful WordPress plugin that enables you to create custom dashboards for your WordPress site. With its drag-and-drop interface, you can easily build dashboards tailored to your needs without any coding required.
Some key features of Ultimate Dashboard Tools include:
Over 50 customizable widgets covering analytics, sales, social media, calendars, and more
Multiple dashboard layouts and color themes to choose from
Import/export dashboards and widgets for reuse
Role-based access controls for secure dashboards
Responsive design works on mobile and desktop
Easily embed dashboards into pages and posts
Developer-friendly with actions, filters, and REST API
Whether you need to monitor website analytics, track sales pipelines, display project schedules, or create management views of your WordPress site, Ultimate Dashboard Tools has the flexibility to create the customized dashboards you need. And with regular updates and new widgets added all the time, it continues getting even more useful.
Kutools for Excel is a powerful Excel add-in developed by Detong Technology Ltd. It provides over 300 advanced tools to help Excel users improve work efficiency by automating repetitive operations.Key features of Kutools for Excel include:Batch processing of Excel files such as compare, copy, delete, protect and unprotect sheetsAdvanced navigation...
think-cell is a software suite designed to simplify the creation of professional-looking charts and presentations, particularly within the Microsoft Office environment. It is known for its integration with Microsoft PowerPoint and Excel, providing tools to streamline the design and formatting of complex charts and visual elements. Key Features: Chart Creation:...
Aploris is a cloud-based web annotation and collaboration platform designed for teams to review, discuss, and approve documents. It allows multiple users to add comments, suggestions, tasks, revisions and more directly on PDFs, Office documents, images, CAD files, and several other file formats.Key features include:Commenting - Annotate documents with text...
Power-user is a third-party software for Windows that unlocks advanced configuration options and customization features aimed at power users and IT professionals. It provides deep-level access to many aspects of Windows that are normally hidden or limited to allow power users to optimize, tweak, and customize their system for improved...
Professor Excel Tools is an add-in for Microsoft Excel that significantly extends its default capabilities when it comes to data analysis, visualization, reporting, and productivity. It was created specifically to help Excel users save time, get more insight from their data, create high-quality charts and reports, and automate repetitive tasks.Key...
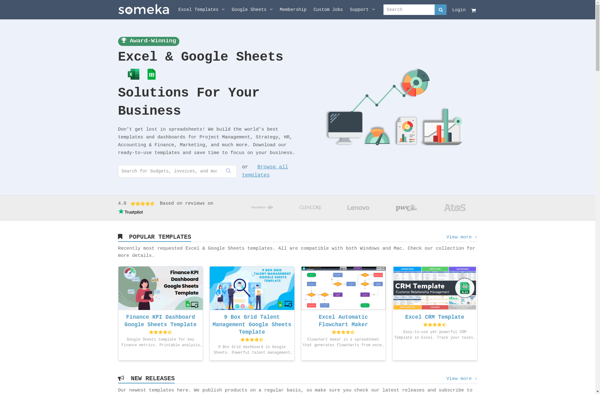
Someka Excel Solutions is an advanced Excel add-in designed to boost productivity for Excel power users, analysts, and teams. It provides a variety of features and tools to help automate repetitive tasks, analyze and visualize data, and streamline reporting in Excel.Key features include:Advanced reporting engine - Quickly generate complex reports...
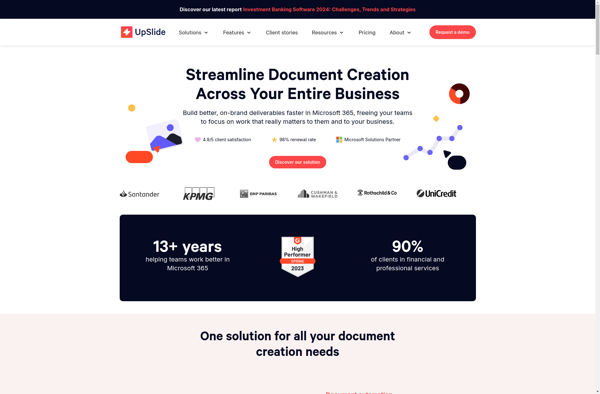
UpSlide is a cloud-based presentation software built for modern teams who create a lot of slide decks. It aims to provide an easy-to-use yet powerful alternative to traditional presentation tools.Some key features of UpSlide include:Drag-and-drop interface to quickly build presentationsNumerous professionally designed templates to choose fromCollaboration tools to work on...
ChartExpo is a versatile business intelligence and data visualization software designed to help companies visualize and analyze data through interactive dashboards. It allows users to connect to various data sources including SQL databases, cloud apps, Excel files, etc. and pull data into the software.Some key features of ChartExpo include:Drag-and-drop interface...
The Peltier Tech Marimekko Chart Utility is a free add-in for Excel that makes it easy to create Marimekko charts, also known as mosaic plots. Marimekko charts are two-dimensional proportional representations that illustrate the distribution of categories across two variables.This utility provides an intuitive interface within Excel for specifying the...
Mekko Graphics is an open-source JavaScript data visualization library developed by Highcharts specifically for creating Mekko charts. Mekko charts are a type of two-axis chart used to visualize part-to-whole relationships between hierarchical data series. They are also sometimes referred to as Marimekko charts.Some key features of Mekko Graphics include:Open-source with...
Zebra BI is a business intelligence and analytics software that empowers business users to visualize and analyze data independently, without relying on IT teams. Some key capabilities and benefits of Zebra BI include:Intuitive drag-and-drop interface for data modeling, visualization design, and dashboard creationConnectors to a wide variety of data sources...
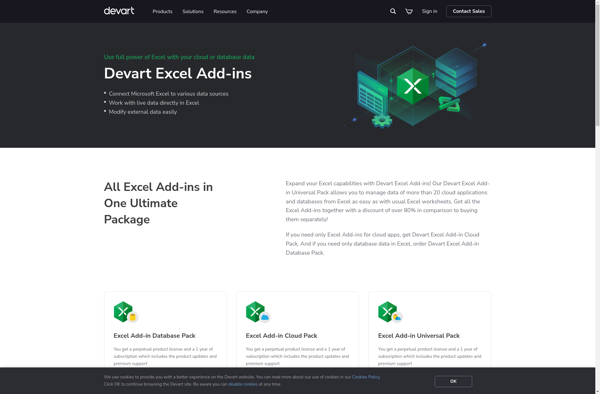
Devart Excel Add-ins are a suite of tools that enhance the capabilities of Excel by providing additional functionality through easy-to-use ribbons and dialog boxes. Some of the key features include:Importing and exporting data from various databases, files, and formats including SQL Server, MySQL, PostgreSQL, SQLite, and moreAdvanced formatting options like...
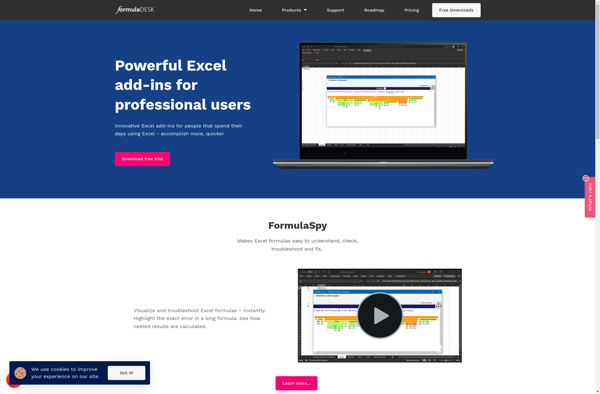
FormulaDesk Navigator is a specialized spreadsheet program designed for engineers, scientists, and other technical professionals. It comes packed with advanced mathematical, statistical, and matrix functions ideal for performing complex calculations, data analysis, and visualization.Some key features include:Powerful math engine that can handle complex formulas, linear algebra, differential equations, and moreAdvanced...
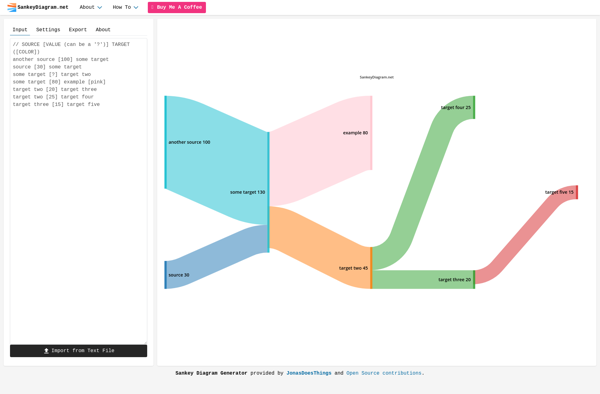
SankeyDiagram.net is a free online application that allows users to easily create Sankey diagrams without the need to download or install any software. Sankey diagrams are a type of flow diagram that visualizes quantitative flows between different entities through proportional arrows.Some key features of SankeyDiagram.net:Intuitive drag and drop interface to...
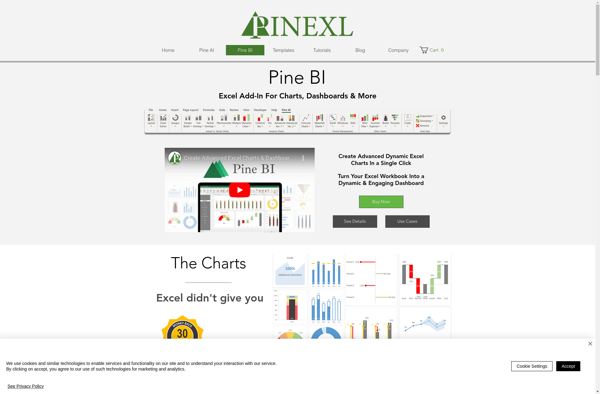
Pine BI is an open-source business intelligence and analytics software that provides a suite of tools for reporting, dashboards, ad-hoc queries, and interactive data visualizations. It is designed to be lightweight, intuitive, and easy to integrate with multiple data sources.Some key features of Pine BI include:Drag-and-drop interface for building reports...
TrueXL is an open-source spreadsheet application developed as a free alternative to Microsoft Excel. TrueXL aims to provide much of the same core spreadsheet functionality that users have come to expect from Excel, but as a completely free and open-source software product.Key features of TrueXL include:Support for familiar Excel workbook...
Airt Magic is a wireless presentation software used to share screens and content from laptops, smartphones, and tablets onto a bigger screen wirelessly. It helps presenters easily share presentations, documents, photos, videos, webpages, and other files during meetings without cables or dongles.Some key features of Airt Magic include:Works cross-platform on...