Peltier Tech Marimekko Chart Utility is a free tool that allows users to easily create Marimekko charts in Excel. It has a simple interface for specifying chart parameters and automatically generates the charts.
Peltier Tech Marimekko Chart Utility is a free tool that allows users to easily create Marimekko charts in Excel. It has a simple interface for specifying chart parameters and automatically generates the charts.
What is Peltier Tech Marimekko Chart Utility?
The Peltier Tech Marimekko Chart Utility is a free add-in for Excel that makes it easy to create Marimekko charts, also known as mosaic plots. Marimekko charts are two-dimensional proportional representations that illustrate the distribution of categories across two variables.
This utility provides an intuitive interface within Excel for specifying the parameters for the Marimekko chart such as the data ranges, labels, colors and sizes. Once the parameters are set, the tool automatically creates the Marimekko chart on a separate worksheet.
Some key features include:
Ability to base the chart on row or column source data
Flexible options for organizing and coloring the display
Control over spacing, border, background and formatting
Works for Excel 2007 and newer versions
As an Excel add-in, the Marimekko Chart Utility integrates seamlessly with existing worksheets. It saves significant time by automating the layout and formatting tasks typically required for this type of chart.
The tool is free to use and there are additional resources on the Peltier Tech website including usage instructions and examples. It's a useful utility for business professionals who want to create Marimekko charts without the hassle.
Peltier Tech Marimekko Chart Utility Features
Features
Generates Marimekko charts in Excel
Allows customization of chart colors and formatting
Handles large datasets
Automatically calculates totals and percentages
Creates both vertical and horizontal Marimekko charts
think-cell is a software suite designed to simplify the creation of professional-looking charts and presentations, particularly within the Microsoft Office environment. It is known for its integration with Microsoft PowerPoint and Excel, providing tools to streamline the design and formatting of complex charts and visual elements. Key Features: Chart Creation:...
Ultimate Dashboard Tools is a powerful WordPress plugin that enables you to create custom dashboards for your WordPress site. With its drag-and-drop interface, you can easily build dashboards tailored to your needs without any coding required.Some key features of Ultimate Dashboard Tools include:Over 50 customizable widgets covering analytics, sales, social...
Aploris is a cloud-based web annotation and collaboration platform designed for teams to review, discuss, and approve documents. It allows multiple users to add comments, suggestions, tasks, revisions and more directly on PDFs, Office documents, images, CAD files, and several other file formats.Key features include:Commenting - Annotate documents with text...
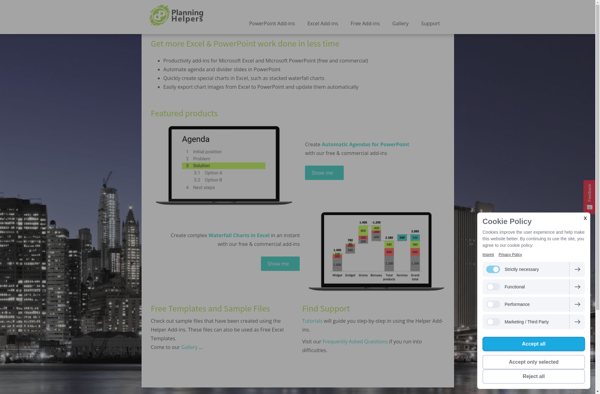
Planning Helpers is a versatile software suite designed to facilitate better planning, task management, and overall organization for teams and individuals. Its key features include:Interactive to-do lists with the ability to categorize tasks, set due dates, attach files, and add commentsKanban-style boards for visualizing workflows and tracking progressShared calendars with...
Someka Excel Solutions is an advanced Excel add-in designed to boost productivity for Excel power users, analysts, and teams. It provides a variety of features and tools to help automate repetitive tasks, analyze and visualize data, and streamline reporting in Excel.Key features include:Advanced reporting engine - Quickly generate complex reports...
PlusX Excel Add-In is an Excel add-on that enhances the capabilities of Microsoft Excel with a variety of additional tools and features. It helps boost productivity for Excel users by automating time-consuming tasks, providing better data visualization options, expanding available Excel functions, and more.Key features of PlusX Excel Add-In include:New...
UpSlide is a cloud-based presentation software built for modern teams who create a lot of slide decks. It aims to provide an easy-to-use yet powerful alternative to traditional presentation tools.Some key features of UpSlide include:Drag-and-drop interface to quickly build presentationsNumerous professionally designed templates to choose fromCollaboration tools to work on...
Mekko Graphics is an open-source JavaScript data visualization library developed by Highcharts specifically for creating Mekko charts. Mekko charts are a type of two-axis chart used to visualize part-to-whole relationships between hierarchical data series. They are also sometimes referred to as Marimekko charts.Some key features of Mekko Graphics include:Open-source with...
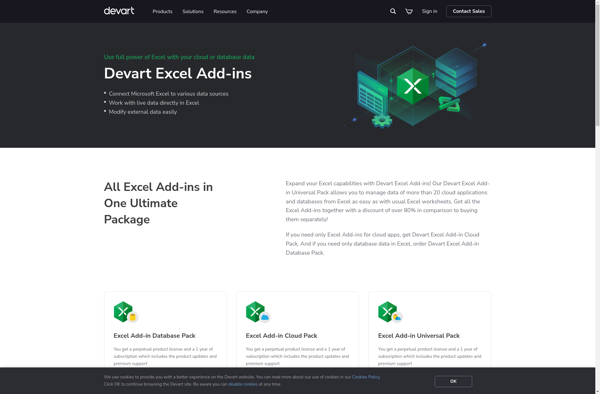
Devart Excel Add-ins are a suite of tools that enhance the capabilities of Excel by providing additional functionality through easy-to-use ribbons and dialog boxes. Some of the key features include:Importing and exporting data from various databases, files, and formats including SQL Server, MySQL, PostgreSQL, SQLite, and moreAdvanced formatting options like...
Quick Dashboard Charts for Excel is an add-in designed to help Excel users visualize data in dashboards and reports without the need for advanced Excel or coding skills. It provides an intuitive interface within Excel to quickly generate professional charts and graphs to gain insights from company data.With Quick Dashboard...
AnyChart is a feature-rich JavaScript charting library that enables developers to easily add interactive charts and dashboards to web and mobile applications. With its lightweight architecture, AnyChart aims to provide high performance chart rendering optimized even for large datasets.AnyChart supports over 80 chart types including column, bar, line, area, pie,...