think-cell is a software add-in for Microsoft PowerPoint and Excel that enhances the creation of charts, graphs, and presentations. It streamlines the process of designing complex charts and ensures a consistent and professional appearance in business presentations.
think-cell: Create Professional Charts and Presentations
A software add-in for Microsoft PowerPoint and Excel, think-cell enhances chart creation, streamlining complex designs and ensuring a professional appearance in business presentations.
What is Think-cell chart?
think-cell is a software suite designed to simplify the creation of professional-looking charts and presentations, particularly within the Microsoft Office environment. It is known for its integration with Microsoft PowerPoint and Excel, providing tools to streamline the design and formatting of complex charts and visual elements.
Key Features:
Chart Creation:
think-cell offers a set of tools to create a wide range of charts, including bar charts, waterfall charts, Gantt charts, scatter plots, and more. Users can easily customize the appearance and style of charts.
Seamless Integration:
The software seamlessly integrates with Microsoft PowerPoint and Excel, enhancing the functionality of these applications. It appears as a set of additional tabs and tools within the PowerPoint and Excel interfaces.
Data Linking:
think-cell allows users to link charts directly to Excel data. This ensures that charts are automatically updated when underlying data in Excel changes, saving time and reducing manual data entry.
Smart Layouts:
Smart layout algorithms help users arrange and align chart elements intelligently. This ensures that charts look polished and professional with minimal effort.
Consistency Across Slides:
think-cell aids in maintaining a consistent appearance across slides. Design elements, such as color schemes and chart formats, can be easily standardized for a cohesive presentation.
Agenda Slides:
The software includes features to automatically generate agenda slides, making it easier to structure and organize presentations.
Ease of Use:
think-cell is designed to be user-friendly, providing an intuitive interface and drag-and-drop functionality. This can help users create sophisticated charts without advanced design skills.
Customization Options:
Users have extensive customization options for charts, allowing them to tailor the appearance and style to match their branding or design preferences.
Data Labels and Annotations:
think-cell supports the addition of data labels, annotations, and other elements to enhance the clarity of charts and graphs.
Efficient Workflow:
By automating repetitive tasks and providing a range of templates and design options, think-cell contributes to an efficient workflow for creating professional presentations.
think-cell is particularly popular in business and corporate environments where creating visually appealing and data-rich presentations is crucial. Its integration with Microsoft Office makes it a convenient choice for users already familiar with these applications.
Ultimate Dashboard Tools is a powerful WordPress plugin that enables you to create custom dashboards for your WordPress site. With its drag-and-drop interface, you can easily build dashboards tailored to your needs without any coding required.Some key features of Ultimate Dashboard Tools include:Over 50 customizable widgets covering analytics, sales, social...
Aploris is a cloud-based web annotation and collaboration platform designed for teams to review, discuss, and approve documents. It allows multiple users to add comments, suggestions, tasks, revisions and more directly on PDFs, Office documents, images, CAD files, and several other file formats.Key features include:Commenting - Annotate documents with text...
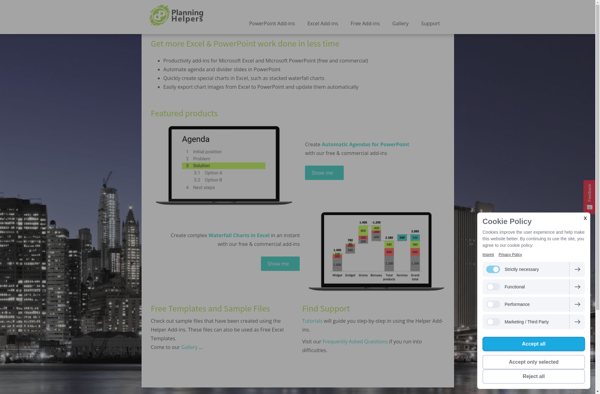
Planning Helpers is a versatile software suite designed to facilitate better planning, task management, and overall organization for teams and individuals. Its key features include:Interactive to-do lists with the ability to categorize tasks, set due dates, attach files, and add commentsKanban-style boards for visualizing workflows and tracking progressShared calendars with...
Power-user is a third-party software for Windows that unlocks advanced configuration options and customization features aimed at power users and IT professionals. It provides deep-level access to many aspects of Windows that are normally hidden or limited to allow power users to optimize, tweak, and customize their system for improved...
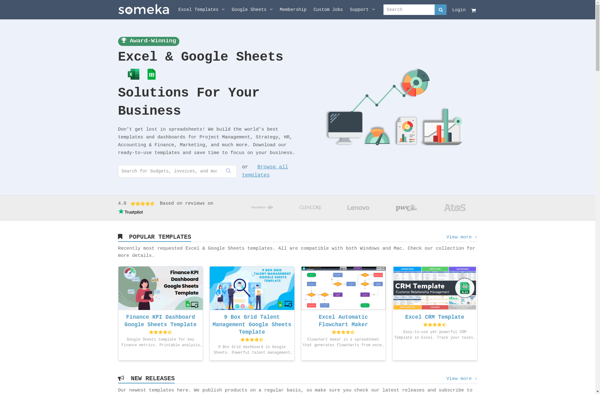
Someka Excel Solutions is an advanced Excel add-in designed to boost productivity for Excel power users, analysts, and teams. It provides a variety of features and tools to help automate repetitive tasks, analyze and visualize data, and streamline reporting in Excel.Key features include:Advanced reporting engine - Quickly generate complex reports...
PlusX Excel Add-In is an Excel add-on that enhances the capabilities of Microsoft Excel with a variety of additional tools and features. It helps boost productivity for Excel users by automating time-consuming tasks, providing better data visualization options, expanding available Excel functions, and more.Key features of PlusX Excel Add-In include:New...
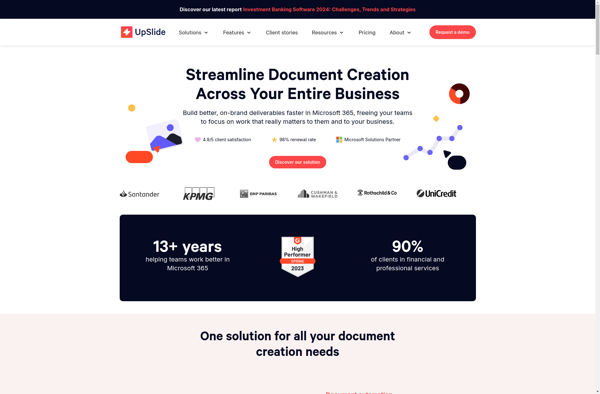
UpSlide is a cloud-based presentation software built for modern teams who create a lot of slide decks. It aims to provide an easy-to-use yet powerful alternative to traditional presentation tools.Some key features of UpSlide include:Drag-and-drop interface to quickly build presentationsNumerous professionally designed templates to choose fromCollaboration tools to work on...
The Peltier Tech Marimekko Chart Utility is a free add-in for Excel that makes it easy to create Marimekko charts, also known as mosaic plots. Marimekko charts are two-dimensional proportional representations that illustrate the distribution of categories across two variables.This utility provides an intuitive interface within Excel for specifying the...
Mekko Graphics is an open-source JavaScript data visualization library developed by Highcharts specifically for creating Mekko charts. Mekko charts are a type of two-axis chart used to visualize part-to-whole relationships between hierarchical data series. They are also sometimes referred to as Marimekko charts.Some key features of Mekko Graphics include:Open-source with...
Grunt.pro is a popular open-source JavaScript task runner used by web developers to automate repetitive tasks in their workflow. Some key features and benefits of Grunt.pro include:Automation of common development tasks like minification, compilation, linting, unit testing etc.Helps improve productivity by eliminating manual repetition of coding tasksEasy to integrate into...
Zebra BI is a business intelligence and analytics software that empowers business users to visualize and analyze data independently, without relying on IT teams. Some key capabilities and benefits of Zebra BI include:Intuitive drag-and-drop interface for data modeling, visualization design, and dashboard creationConnectors to a wide variety of data sources...
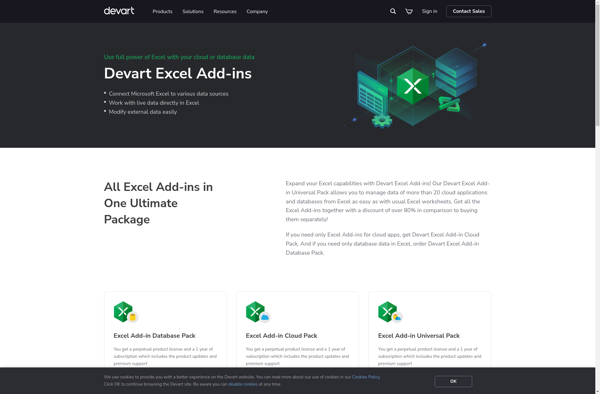
Devart Excel Add-ins are a suite of tools that enhance the capabilities of Excel by providing additional functionality through easy-to-use ribbons and dialog boxes. Some of the key features include:Importing and exporting data from various databases, files, and formats including SQL Server, MySQL, PostgreSQL, SQLite, and moreAdvanced formatting options like...
Quick Dashboard Charts for Excel is an add-in designed to help Excel users visualize data in dashboards and reports without the need for advanced Excel or coding skills. It provides an intuitive interface within Excel to quickly generate professional charts and graphs to gain insights from company data.With Quick Dashboard...
Vizzlo is an easy-to-use data visualization and infographic software tool that empowers anyone, regardless of design experience, to create beautiful, professional data visualizations, infographics, presentations and reports in just minutes.With an intuitive drag-and-drop interface and access to a massive library of charts, maps, shapes and illustrations, Vizzlo makes it simple...
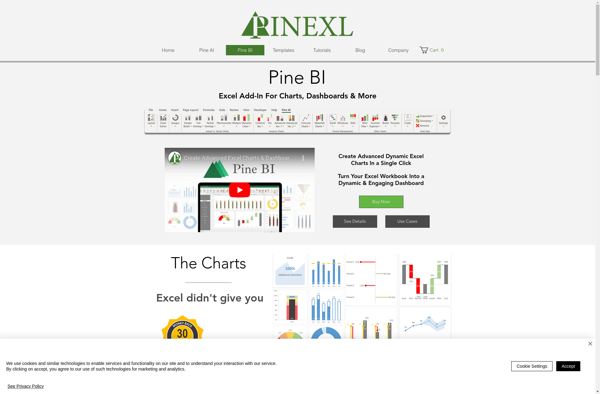
Pine BI is an open-source business intelligence and analytics software that provides a suite of tools for reporting, dashboards, ad-hoc queries, and interactive data visualizations. It is designed to be lightweight, intuitive, and easy to integrate with multiple data sources.Some key features of Pine BI include:Drag-and-drop interface for building reports...
Chartrics is a powerful yet easy-to-use data visualization and analytics platform for creating interactive charts, graphs, and dashboards. With its intuitive drag-and-drop interface, anyone can quickly turn raw data into meaningful visualizations and share insights.Key features of Chartrics include:Import data from a variety of sources like CSVs, databases, and other...
Airt Magic is a wireless presentation software used to share screens and content from laptops, smartphones, and tablets onto a bigger screen wirelessly. It helps presenters easily share presentations, documents, photos, videos, webpages, and other files during meetings without cables or dongles.Some key features of Airt Magic include:Works cross-platform on...
AnyChart is a feature-rich JavaScript charting library that enables developers to easily add interactive charts and dashboards to web and mobile applications. With its lightweight architecture, AnyChart aims to provide high performance chart rendering optimized even for large datasets.AnyChart supports over 80 chart types including column, bar, line, area, pie,...