Zebra BI
Zebra BI is a business intelligence and analytics platform that provides self-service data visualization and dashboard creation capabilities for business users. It allows users to connect to various data sources, model data for analysis, and create interactive dashboards and repo

Zebra BI: Business Intelligence and Analytics Platform
Self-service data visualization and dashboard creation capabilities for business users, connecting to various data sources, modeling data for analysis, and interactive dashboards and reports without coding.
What is Zebra BI?
Zebra BI is a business intelligence and analytics software that empowers business users to visualize and analyze data independently, without relying on IT teams. Some key capabilities and benefits of Zebra BI include:
- Intuitive drag-and-drop interface for data modeling, visualization design, and dashboard creation
- Connectors to a wide variety of data sources such as databases, cloud apps, etc.
- 250+ customizable data visualization types including charts, tables, maps, gauges etc.
- Interactive dashboards with filtering, drilling, sorting, alerting and more
- Collaboration features to share and discuss insights with annotations and comments
- Governance capabilities for data source and dashboard access control, versioning etc.
- On-premise and cloud deployment options available
- Mobile apps for access to dashboards on the go
- Scheduled data refresh and reporting for real-time analytics
- Supports large data volumes and high user concurrency
With an intuitive interface empowering business users combined with scalable data visualization engine, Zebra BI enables organizations to democratize data access for faster insights and better decisions.
Zebra BI Features
Features
- Drag-and-drop interface for building dashboards
- Connectors for databases, cloud apps, files
- Data modeling and ETL capabilities
- Customizable visualizations and charts
- Collaboration tools like annotations and sharing
- Mobile optimization of dashboards
- AI-powered analytics and insights
- Embedded analytics capabilities
- Governance features like row-level security
Pricing
- Freemium
- Subscription-Based
Pros
Intuitive and easy to use
Great for self-service BI and data democratization
Affordable pricing
Fast to implement and get started
Integrates well with other systems
Good for non-technical users
Cons
Less advanced than some competitor platforms
Limited options for large enterprise deployments
Not as customizable as open-source tools
Can be slow with large complex data sets
Lacks some advanced analytics features
Official Links
Reviews & Ratings
Login to ReviewThe Best Zebra BI Alternatives
Top Business & Commerce and Business Intelligence & Analytics and other similar apps like Zebra BI
Tableau
Tableau is a leading business intelligence and data visualization platform used by organizations of all sizes to transform their data into easy-to-understand visualizations and dashboards. With Tableau, users can connect to a wide range of data sources, prepare and clean the data for analysis, and create interactive data visualizations such...

Think-cell chart
think-cell is a software suite designed to simplify the creation of professional-looking charts and presentations, particularly within the Microsoft Office environment. It is known for its integration with Microsoft PowerPoint and Excel, providing tools to streamline the design and formatting of complex charts and visual elements. Key Features: Chart Creation:...

Google Charts
Google Charts is a robust and flexible JavaScript charting and data visualization library provided for free by Google. It offers developers a highly customizable way to create interactive charts, graphs, and data tables that seamlessly integrate into web pages and applications.With Google Charts, you can visualize complex data sets and...

Ultimate Dashboard Tools
Ultimate Dashboard Tools is a powerful WordPress plugin that enables you to create custom dashboards for your WordPress site. With its drag-and-drop interface, you can easily build dashboards tailored to your needs without any coding required.Some key features of Ultimate Dashboard Tools include:Over 50 customizable widgets covering analytics, sales, social...

Someka Excel Solutions
Someka Excel Solutions is an advanced Excel add-in designed to boost productivity for Excel power users, analysts, and teams. It provides a variety of features and tools to help automate repetitive tasks, analyze and visualize data, and streamline reporting in Excel.Key features include:Advanced reporting engine - Quickly generate complex reports...
PlusX Excel Add-In
PlusX Excel Add-In is an Excel add-on that enhances the capabilities of Microsoft Excel with a variety of additional tools and features. It helps boost productivity for Excel users by automating time-consuming tasks, providing better data visualization options, expanding available Excel functions, and more.Key features of PlusX Excel Add-In include:New...

Mekko Graphics
Mekko Graphics is an open-source JavaScript data visualization library developed by Highcharts specifically for creating Mekko charts. Mekko charts are a type of two-axis chart used to visualize part-to-whole relationships between hierarchical data series. They are also sometimes referred to as Marimekko charts.Some key features of Mekko Graphics include:Open-source with...

Devart Excel Add-ins
Devart Excel Add-ins are a suite of tools that enhance the capabilities of Excel by providing additional functionality through easy-to-use ribbons and dialog boxes. Some of the key features include:Importing and exporting data from various databases, files, and formats including SQL Server, MySQL, PostgreSQL, SQLite, and moreAdvanced formatting options like...
Quick Dashboard Charts for Excel
Quick Dashboard Charts for Excel is an add-in designed to help Excel users visualize data in dashboards and reports without the need for advanced Excel or coding skills. It provides an intuitive interface within Excel to quickly generate professional charts and graphs to gain insights from company data.With Quick Dashboard...

Marple
Marple is an open-source, Markdown-based slide deck tool for creating presentations. It provides a minimalistic editor interface to write slide content in Markdown format, which then gets rendered into an elegant slide deck for presenting.Some key features of Marple:Write slide content in easy-to-read and write Markdown format. Format headings, lists,...
Zoho Analytics
Zoho Analytics is a powerful yet user-friendly business intelligence and data analytics platform used by organizations of all sizes. It allows you to connect data from multiple sources including databases, cloud apps, and files, enabling a unified view of business data.With an intuitive drag-and-drop interface, Zoho Analytics makes it easy...
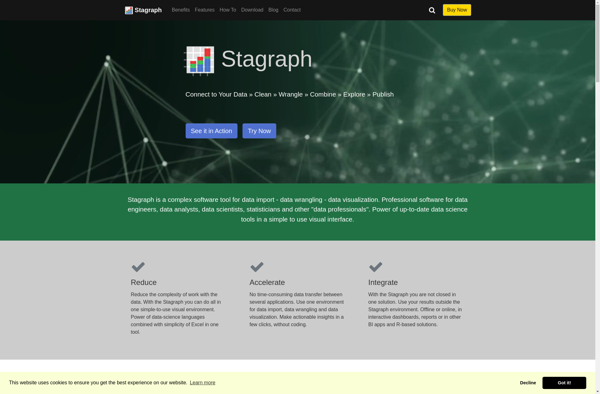
Stagraph
Stagraph is a powerful yet easy-to-use data visualization and analytics platform designed for modern business needs. As a cloud-based solution, Stagraph enables users to effortlessly map, analyze, and gain actionable insights from even the most complex data sets through intuitive drag-and-drop visualizations.Key capabilities and benefits include:Intelligible and interactive data visualizations...
Airt Magic
Airt Magic is a wireless presentation software used to share screens and content from laptops, smartphones, and tablets onto a bigger screen wirelessly. It helps presenters easily share presentations, documents, photos, videos, webpages, and other files during meetings without cables or dongles.Some key features of Airt Magic include:Works cross-platform on...