Zoho Analytics
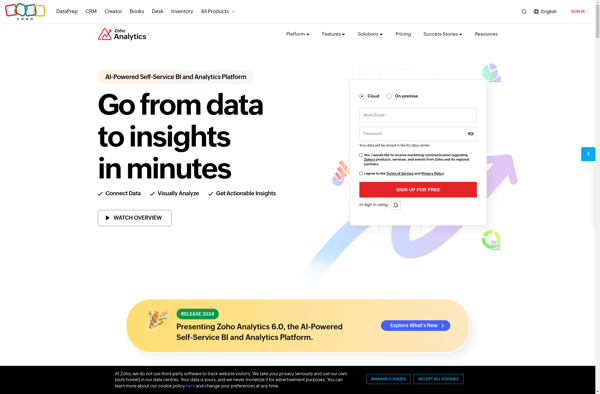
Zoho Analytics: Business Intelligence and Data Analytics Software
Connect multiple data sources, visualize with interactive dashboards and reports, and gain actionable insights with Zoho Analytics, a user-friendly business intelligence and data analytics software
What is Zoho Analytics?
Zoho Analytics is a powerful yet user-friendly business intelligence and data analytics platform used by organizations of all sizes. It allows you to connect data from multiple sources including databases, cloud apps, and files, enabling a unified view of business data.
With an intuitive drag-and-drop interface, Zoho Analytics makes it easy for non-technical users to create interactive dashboards and reports that provide actionable insights through rich visualizations like charts, graphs, heat maps, and more. You can visualize data in real time and share reports enterprise-wide.
Key features include data preparation, predictive analytics, data discovery, customizable reporting, scheduled report distribution, alert notifications based on metric thresholds, API and database connectivity, and more. It can handle large data volumes and integrate seamlessly with 300+ apps.
Zoho Analytics focuses on self-service BI, fostering a culture of fact-driven decision making across the organization. With affordable pricing suited for companies of all sizes, it's a great alternative to complex tools like Tableau, Microsoft Power BI, and Qlik Sense.
Zoho Analytics Features
Features
- Connect data from multiple sources
- Create interactive dashboards and reports
- Gain actionable insights
- Easy-to-use tools for non-technical users
Pricing
- Freemium
- Subscription-Based
Pros
Cons
Official Links
Reviews & Ratings
Login to ReviewThe Best Zoho Analytics Alternatives
View all Zoho Analytics alternatives with detailed comparison →
Top Business & Commerce and Business Intelligence & Analytics and other similar apps like Zoho Analytics
Here are some alternatives to Zoho Analytics:
Suggest an alternative ❐SAP BusinessObjects

Widestage
Many Eyes
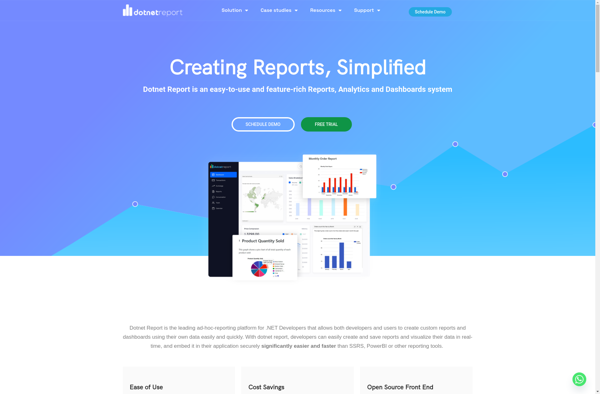
Dotnet Report Builder
Zebra BI

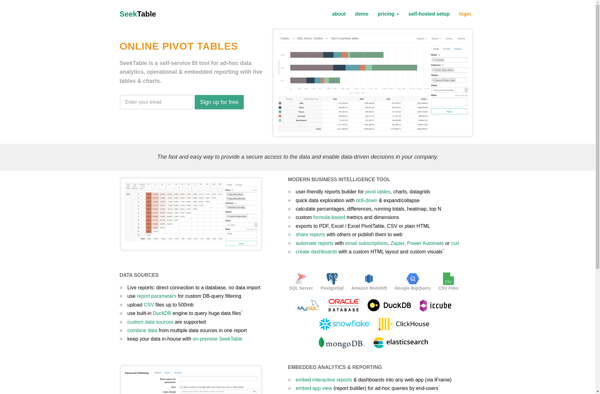
SeekTable
Angoss KnowledgeSEEKER

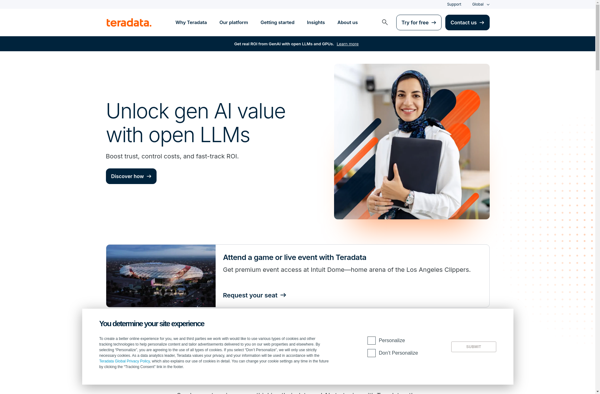
Teradata
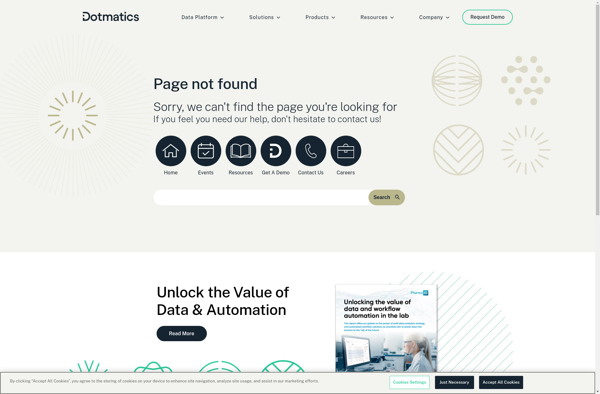
Dotmatics Vortex
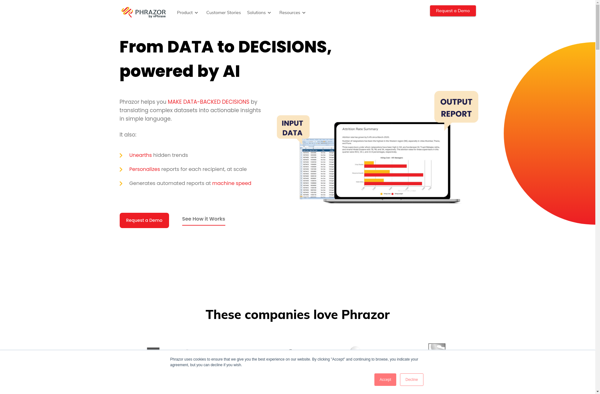
Phrazor
Cortana Analytics
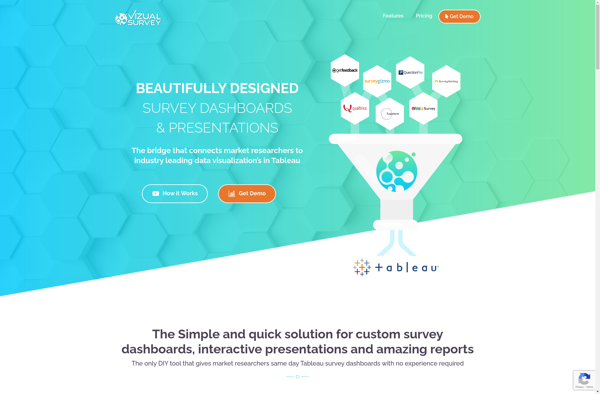
VizualSurvey
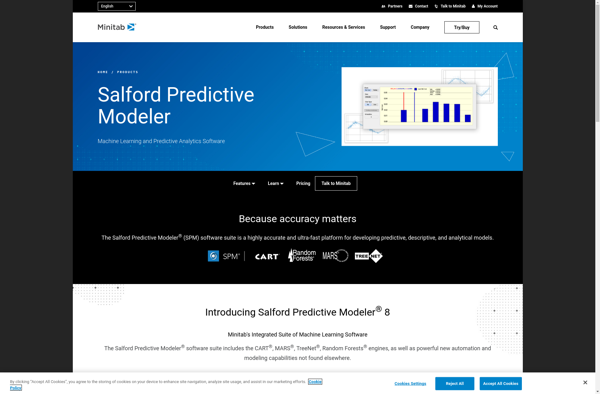
Salford Systems
ClearStory Data
Analyza
YellowFin

ProClarity
Progress OpenEdge
JReport
DataPad
DrillDb
Pyramid Analytics