VizualSurvey
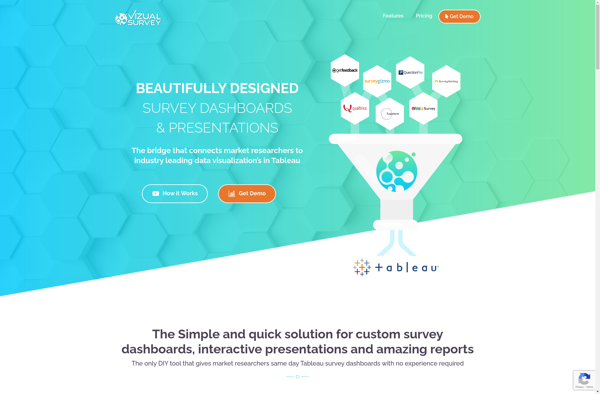
VizualSurvey: Online Survey and Form Builder
Create professional-looking surveys, polls, and questionnaires with drag-and-drop functionality, various question types, logic options, and customizable themes.
What is VizualSurvey?
VizualSurvey is a powerful yet easy-to-use online survey creator that empowers users of all skill levels to make professional surveys in minutes. With its intuitive drag-and-drop builder and variety of customizable themes, even beginners can design great-looking online forms tailored to their needs.
Some key features of VizualSurvey include:
- Drag-and-drop survey builder that allows you to easily add, edit, and rearrange questions
- Support for all common question types including single/multiple choice, rating scales, open-ended, demographics, etc.
- Advanced logic like skip logic, branching, piping to personalize the survey flow based on responses
- Randomization of questions and answers to reduce bias
- Custom themes and colors to match your brand
- Survey distribution via email, social media, website embed code, and QR codes
- Detailed real-time response analytics and reports
- Option to export results to Excel, PDF etc.
With VizualSurvey you can get responses faster, understand your audience better, and make smarter decisions backed by data. It's the easiest way to get feedback from customers, employees, students, event attendees and more in today's digital age.
VizualSurvey Features
Features
- Drag-and-drop survey builder
- Various question types (multiple choice, rating scale, open-ended, etc.)
- Skip logic and branching
- Multiple survey themes and custom branding
- Collect responses via web link, email, social media, QR code
- Real-time response analytics and reports
- Data export to Excel, CSV, PDF
- Collaboration tools
- Multilingual surveys
Pricing
- Freemium
- Subscription-Based
Pros
Cons
Official Links
Reviews & Ratings
Login to ReviewThe Best VizualSurvey Alternatives
View all VizualSurvey alternatives with detailed comparison →
Top Online Services and Survey & Form Builders and other similar apps like VizualSurvey
Here are some alternatives to VizualSurvey:
Suggest an alternative ❐Microsoft Power BI

Tableau

QlikView

Sisense

Marple

Zoho Analytics