Teradata

Teradata

Teradata is an enterprise data warehousing solution that enables large-scale data storage and analysis. It is optimized for high performance analytics on large volumes of data.
Teradata image
data-warehousing analytics big-data

Teradata: Enterprise Data Warehousing

Teradata is an enterprise data warehousing solution that enables large-scale data storage and analysis, optimized for high performance analytics on large volumes of data.

What is Teradata?

Teradata is a leading enterprise data warehousing solution designed for large-scale data storage, management, and analysis. It leverages parallel processing and advanced database design to enable high-performance analytics on petabyte-scale data volumes.

Some key capabilities and benefits of Teradata include:

  • Massive scalability and storage capacity for storing hundreds of terabytes to petabytes of structured and unstructured data
  • Advanced SQL and analytics functions for deep and complex analysis of data
  • High availability features for 24/7 access with failover and disaster recovery
  • Workload management and prioritization for optimizing multiple types of workloads
  • Security features like encryption, access controls, auditing for regulatory compliance
  • Unified data architecture that consolidates data warehouses, data lakes, and data marts into one platform

Teradata is commonly used by large enterprises in telecommunications, financial services, retail, healthcare, and government sectors that need to analyze vast amounts of data for business insights. It runs on both on-premises infrastructure as well as public and private clouds.

Teradata Features

Features

  1. Scalable data storage and processing
  2. Parallel processing for high-performance analytics
  3. Advanced SQL capabilities for complex queries
  4. Integrated data management and governance tools
  5. Supports a wide range of data types and sources
  6. Powerful analytical and reporting capabilities

Pricing

  • Subscription-Based

Pros

Highly scalable and optimized for large data volumes

Robust security and data governance features

Extensive analytical and reporting capabilities

Experienced and knowledgeable support team

Integrates well with other enterprise systems

Cons

Relatively high cost compared to other data warehousing solutions

Complex to set up and maintain, requiring specialized expertise

Limited support for real-time or streaming data processing

Proprietary technology, which can limit flexibility and integration with other tools


The Best Teradata Alternatives

Top Business & Commerce and Data Analytics and other similar apps like Teradata


Tableau icon

Tableau

Tableau is a leading business intelligence and data visualization platform used by organizations of all sizes to transform their data into easy-to-understand visualizations and dashboards. With Tableau, users can connect to a wide range of data sources, prepare and clean the data for analysis, and create interactive data visualizations such...
Tableau image
QlikView icon

QlikView

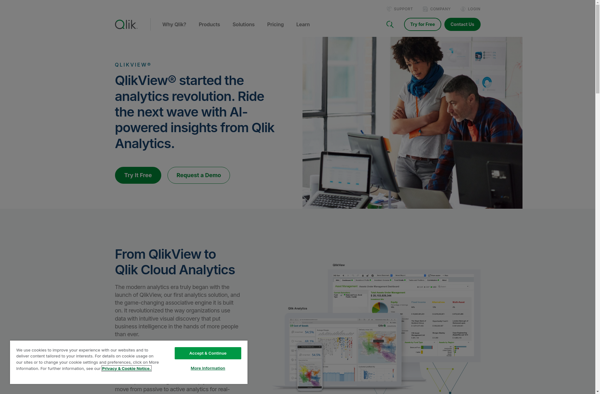
QlikView is a business intelligence and data visualization platform used to create interactive dashboards and analytics applications. It was first released in 1993 by the Swedish company Qlik. Key features of QlikView include:Associative data modeling and in-memory analytics engine - Allows fast analysis of large, disparate datasets without predefined schema...
QlikView image
Google Charts icon

Google Charts

Google Charts is a robust and flexible JavaScript charting and data visualization library provided for free by Google. It offers developers a highly customizable way to create interactive charts, graphs, and data tables that seamlessly integrate into web pages and applications.With Google Charts, you can visualize complex data sets and...
Google Charts image
Cluvio icon

Cluvio

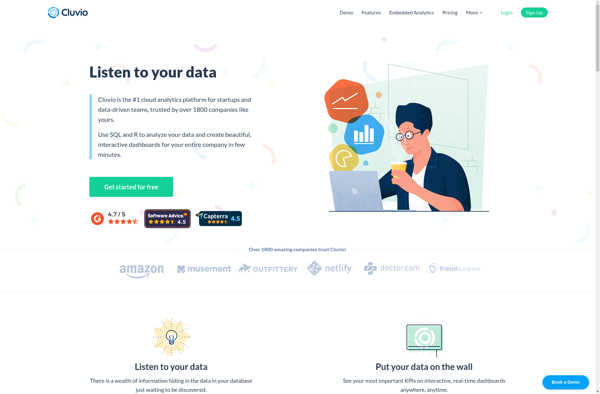
Cluvio is a business intelligence and analytics software designed for small and medium-sized businesses. It aims to make data analytics accessible to non-technical users through an intuitive graphical interface. Some key capabilities and benefits of Cluvio include:Interactive dashboards - Users can create customizable dashboards to visualize important business metrics and...
Cluvio image
AppInsights icon

AppInsights

AppInsights is an extensive application performance management (APM) service provided by Microsoft Azure. It allows developers to easily monitor their live web applications and track key metrics like response time, failure rates, dependency rates, and more. Some key capabilities of AppInsights:Monitor response time, failure rates, exceptions to identify performance issues...
AppInsights image
QueryTree icon

QueryTree

QueryTree is a visual SQL analytics software designed to make query building fast and easy for any skill level. It features an intuitive drag-and-drop interface that allows users to construct complex SQL queries visually without typing code.Some key features of QueryTree include:Visual query builder with drag-and-drop fields and quick type...
QueryTree image
Marple icon

Marple

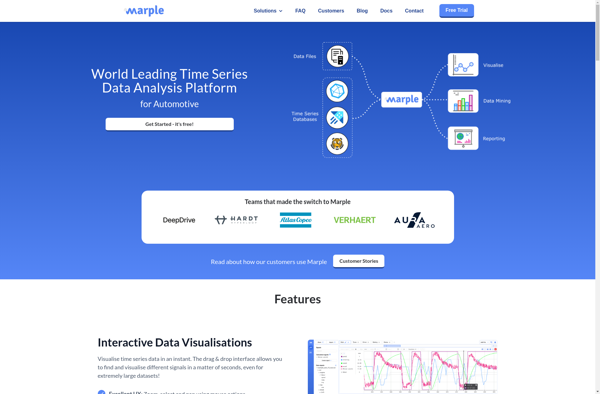
Marple is an open-source, Markdown-based slide deck tool for creating presentations. It provides a minimalistic editor interface to write slide content in Markdown format, which then gets rendered into an elegant slide deck for presenting.Some key features of Marple:Write slide content in easy-to-read and write Markdown format. Format headings, lists,...
Marple image
Zoho Analytics icon

Zoho Analytics

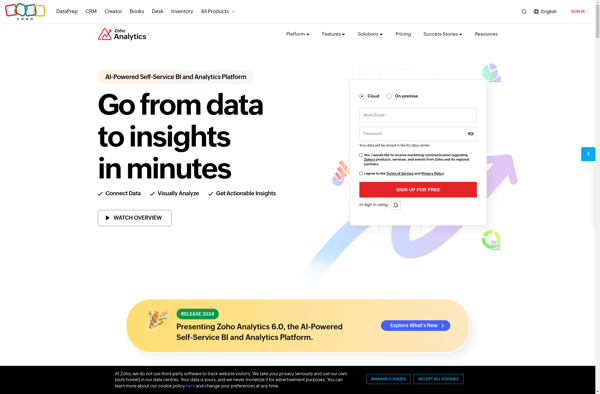
Zoho Analytics is a powerful yet user-friendly business intelligence and data analytics platform used by organizations of all sizes. It allows you to connect data from multiple sources including databases, cloud apps, and files, enabling a unified view of business data.With an intuitive drag-and-drop interface, Zoho Analytics makes it easy...
Zoho Analytics image
Stagraph icon

Stagraph

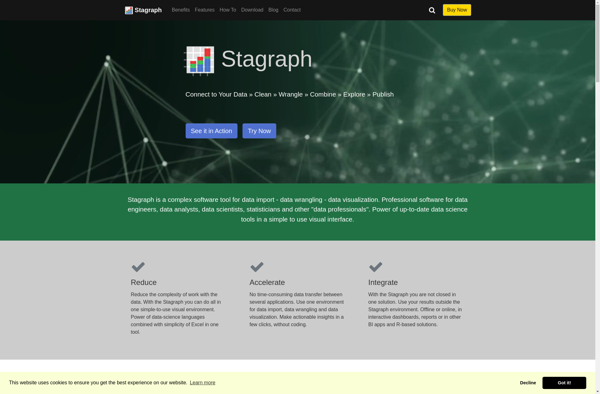
Stagraph is a powerful yet easy-to-use data visualization and analytics platform designed for modern business needs. As a cloud-based solution, Stagraph enables users to effortlessly map, analyze, and gain actionable insights from even the most complex data sets through intuitive drag-and-drop visualizations.Key capabilities and benefits include:Intelligible and interactive data visualizations...
Stagraph image
ChartURL icon

ChartURL

ChartURL is an open-source data visualization and charting software used to create interactive visualizations from data. It can connect to various data sources like SQL databases, CSV files, REST APIs and more to import data and auto-generate charts and dashboards. Key features include:Intuitive drag-and-drop interface to build dashboardsSupport for multiple...
ChartURL image
Progress OpenEdge icon

Progress OpenEdge

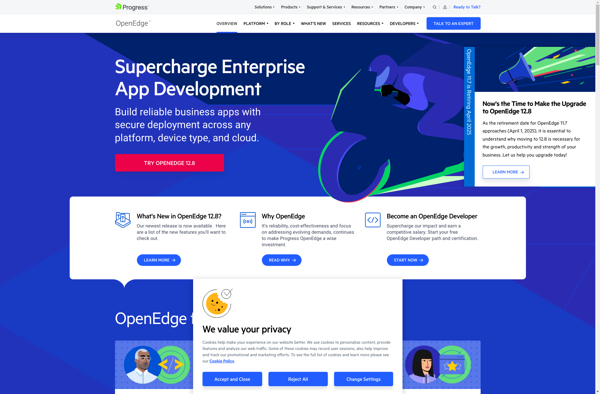
Progress OpenEdge is a development platform optimized for creating business applications. It includes a 4th generation programming language (4GL) designed for rapid application development along with tools for building user interfaces, reporting, integration, and application management.Key features of Progress OpenEdge include:4GL language for faster coding and reduced maintenance costs compared...
Progress OpenEdge image