SeekTable
SeekTable: Browser Extension & Web App for Efficient Web Navigation
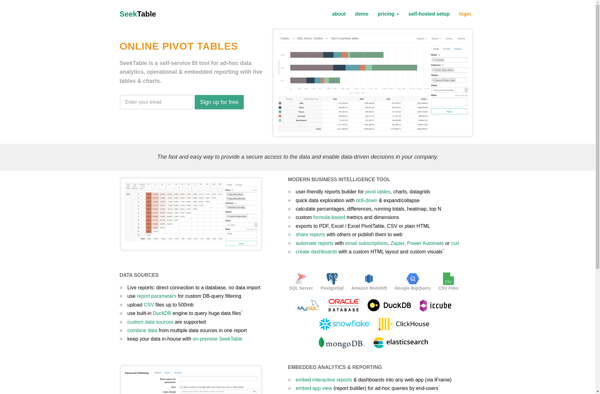
Discover SeekTable, a powerful browser extension and web app that simplifies your online experience by outlining tables, charts, and graphs on web pages.
What is SeekTable?
SeekTable is a browser extension and web app that helps you navigate websites more efficiently. It works by outlining tables, charts, and graphs on web pages so you can easily scan, search, and summarize data.
Once installed, SeekTable will detect tables, charts, and graphs on a web page and draw red outlines around them. You can then click on an outline to pull up a pop-up summary of the data contained within. This saves you from having to visually scan the entire page.
Within the pop-up, you can search for keywords or values in the data to help you zero in on the information you need. SeekTable also summarizes charts and graphs into key statistics and highlights so you can grasp the main insights more quickly.
Beyond the browser extension, SeekTable offers a web application for analyzing and collaborating on data found on websites. You can clip information from multiple sites into a project and share insights with teammates.
In summary, SeekTable streamlines researching and reporting on data from across the web. Its outlines, summaries, and search make extracting and understanding key information much faster.
SeekTable Features
Features
- Outlines tables, charts, and graphs on web pages
- Lets you easily scan, search, and summarize data
- Available as a browser extension and web app
- Works on many popular websites like Wikipedia, Yahoo Finance, etc.
Pricing
- Freemium
Pros
Cons
Official Links
Reviews & Ratings
Login to ReviewThe Best SeekTable Alternatives
View all SeekTable alternatives with detailed comparison →
Top Ai Tools & Services and Data Extraction and other similar apps like SeekTable
Here are some alternatives to SeekTable:
Suggest an alternative ❐Microsoft Power BI

Tableau

SQL Server Reporting Services

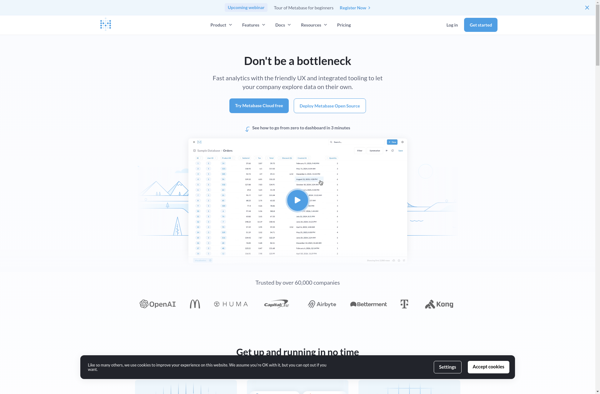
Metabase
Looker Studio

Pentaho

Redash

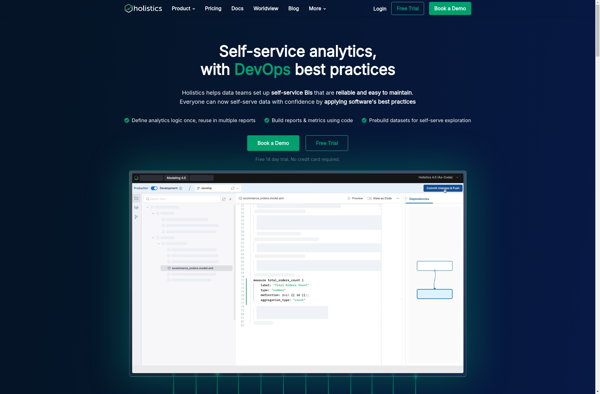
Holistics Software
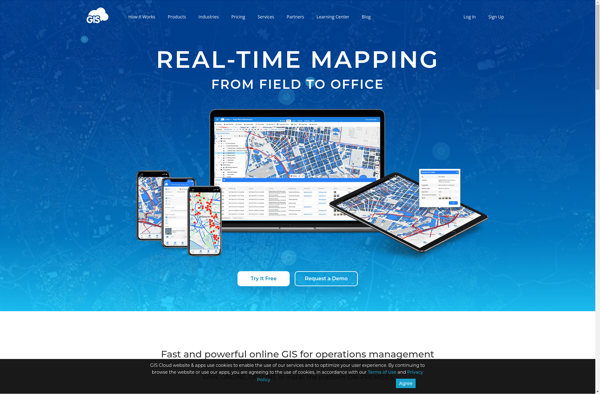
GIS Cloud
Zoho Analytics
Bipp Analytics
