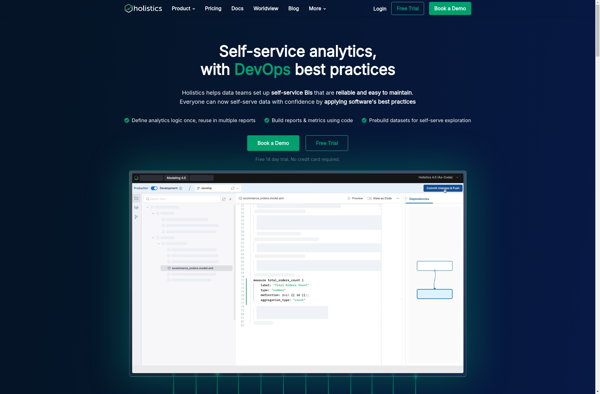
Holistics is an AI-powered unified data platform that enables data teams to build, unify, operationalize, and govern all their data assets for analytics and machine learning. It allows easy data ingestion, preparation, analytics, and visualization while ensuring security, privacy
Holistics enables data teams to build, unify, operationalize, and govern all their data assets for analytics and machine learning, with features like easy data ingestion, preparation, analytics, and visualization while ensuring security, privacy, and governance over data.
What is Holistics Software?
Holistics is an AI-powered unified data platform designed to help companies build and manage their data infrastructure. It provides an intuitive interface for data teams to ingest, prepare, analyze, and visualize data from diverse sources.
Key capabilities include:
Smart data collection and ingestion from databases, cloud apps, APIs etc.
Automated data mapping, cleansing, normalization and enrichment powered by AI.
Unified data catalog with full lineage tracking.
No-code analytics, reporting and dashboarding.
Enterprise semantic layer to standardize metrics.
Collaboration features like sharing, annotations and discussions.
Detailed access control, data masking and encryption for security.
Audit logs and impact analysis for governance.
Open and extensible architecture to integrate with other apps.
Holistics aims to help data teams be more productive by eliminating redundant and manual tasks. Its automated data management and built-in AI/ML models accelerate analytics velocity. The platform provides a single source of truth for enterprise data while ensuring security, privacy and governance over data.
Microsoft Power BI is a powerful business analytics service developed by Microsoft. It empowers users to transform raw data into meaningful insights, create interactive reports and dashboards, and share data-driven stories within an organization. Power BI is designed to help businesses and individuals make informed decisions based on a comprehensive...
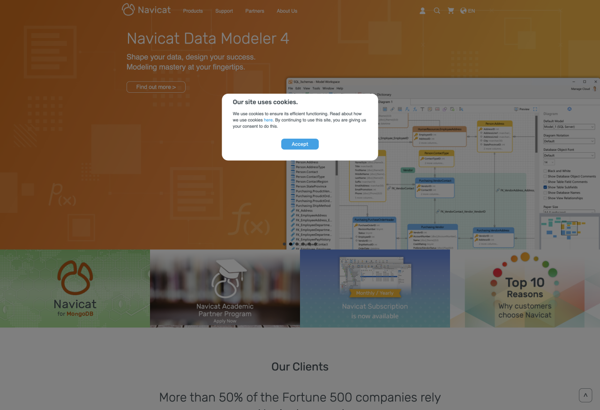
Navicat is a powerful graphical database administration tool used for database development and administration. It allows you to connect to MySQL, MariaDB, SQL Server, Oracle, PostgreSQL and SQLite databases, build queries, design database structures, transfer data between databases, and manage other database operations.Key features of Navicat include:Visual database designer for...
Tableau is a leading business intelligence and data visualization platform used by organizations of all sizes to transform their data into easy-to-understand visualizations and dashboards. With Tableau, users can connect to a wide range of data sources, prepare and clean the data for analysis, and create interactive data visualizations such...
JasperReports is an open source Java reporting library that can generate various types of reports from different data sources. It is very flexible and offers many features:Supports connecting to various data sources like SQL databases, NoSQL databases, XML, JSON, CSV files, etc.Can generate reports in multiple formats including PDF, HTML,...
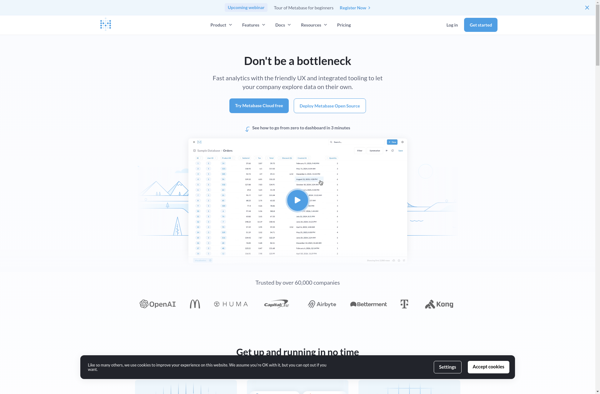
Metabase is an open source business intelligence platform and analytics tool. It allows anyone on a team to ask questions about their data, explore it, and share insights with others through easy-to-create dashboards, charts, and visualizations. Metabase provides an intuitive frontend interface so users can get answers and discover trends...
QlikView is a business intelligence and data visualization platform used to create interactive dashboards and analytics applications. It was first released in 1993 by the Swedish company Qlik. Key features of QlikView include:Associative data modeling and in-memory analytics engine - Allows fast analysis of large, disparate datasets without predefined schema...
Redash is an open-source business intelligence and data visualization web application. It allows users to connect to multiple data sources including SQL databases, query and visualize the data, and create interactive dashboards to share insights.Some key features of Redash:Connect to data sources like PostgreSQL, MySQL, SQL Server, Redshift, BigQuery and...
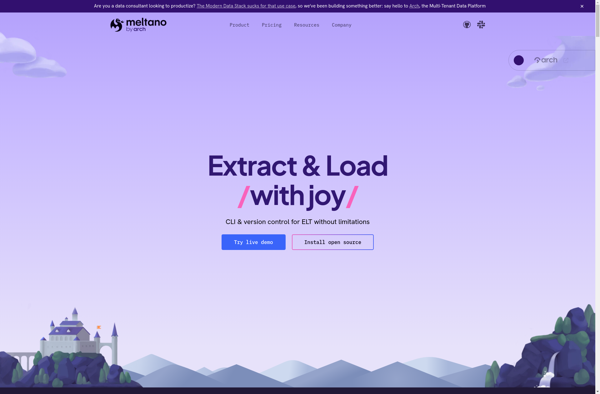
Meltano is an open source data integration and ELT (extract, load, transform) platform aimed at helping data engineers and analysts more easily move, transform, and load data from various sources into data warehouses or visualization platforms. Features include:Visual interface for building data pipelines by connecting data sources, adding transformations, scheduling...
Sisense is a business intelligence and data analytics software platform designed to help non-technical users prepare, analyze and visualize complex data. Some key features of Sisense include:Intuitive drag-and-drop interface for building interactive dashboards and visualizations like charts, graphs and pivot tables without coding.Ability to connect to wide variety of data...
Amazon QuickSight is a fast, cloud-powered business intelligence service that makes it easy to build visualizations, perform ad-hoc analysis, and quickly get business insights from your data. Some key features include:Intuitive visual interface that makes it easy to visualize and explore dataBroad data connectivity to connect to data sources like...
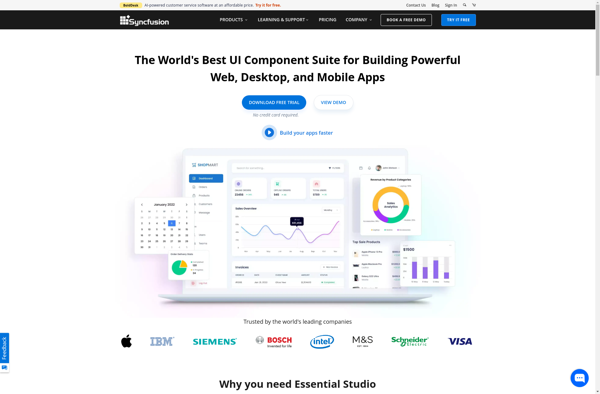
The Syncfusion Dashboard Platform is a comprehensive business intelligence and analytics solution designed specifically for data visualization and dashboard creation. It allows you to connect to almost any data source, including SQL databases, Excel files, REST APIs, and more, and transform that data into stunning, interactive dashboards.With an intuitive drag-and-drop...
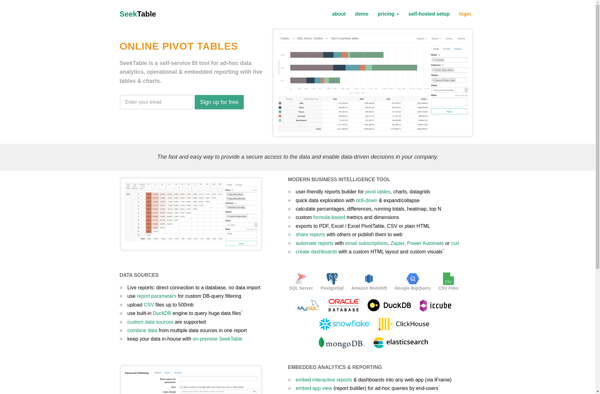
SeekTable is a browser extension and web app that helps you navigate websites more efficiently. It works by outlining tables, charts, and graphs on web pages so you can easily scan, search, and summarize data.Once installed, SeekTable will detect tables, charts, and graphs on a web page and draw red...
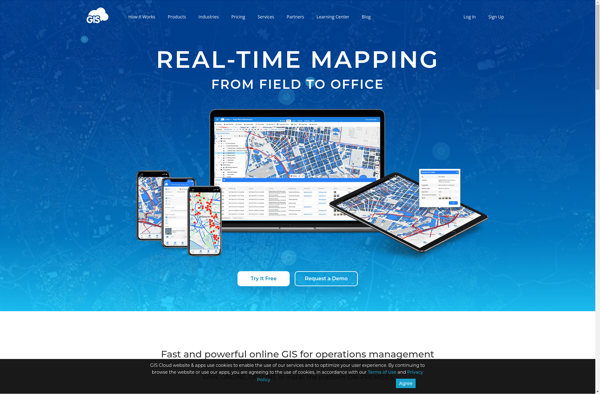
GIS Cloud is a feature-rich, cloud-based geographic information system (GIS) software designed for organizations of all sizes. It enables users to easily create, edit, analyze, and publish geospatial data through an intuitive web interface and mobile apps.Key capabilities and benefits of GIS Cloud include:Interactive web map building with access to...
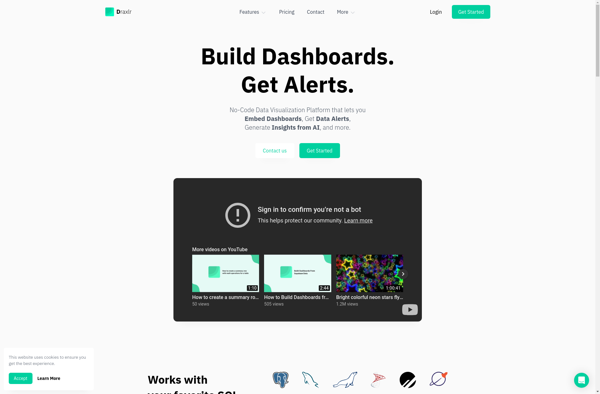
Draxlr is an open-source project management and collaboration tool similar to Trello. It allows you to create boards containing lists and cards to plan tasks and projects.Some key features of Draxlr include:Custom boards with as many columns and cards as you needDrag-and-drop interface to easily reorder cardsMultiple assigned members per...
Marple is an open-source, Markdown-based slide deck tool for creating presentations. It provides a minimalistic editor interface to write slide content in Markdown format, which then gets rendered into an elegant slide deck for presenting.Some key features of Marple:Write slide content in easy-to-read and write Markdown format. Format headings, lists,...
Cirkulate is an open-source, self-hosted alternative to Google Analytics that allows web developers and site owners to track traffic and analyze usage statistics without compromising visitor privacy. Some key features of Cirkulate include:Lightweight and easy to install. Cirkulate uses a SQLite database and PHP scripts, making it simple to set...
DataMill is an open-source data catalog and metadata management solution designed to help organizations get more value from their data. Here are some key capabilities:Automated data discovery and cataloging - DataMill crawls data stores like databases, data warehouses, file shares etc. to automatically catalog metadata and make data sets discoverable.Searchable...
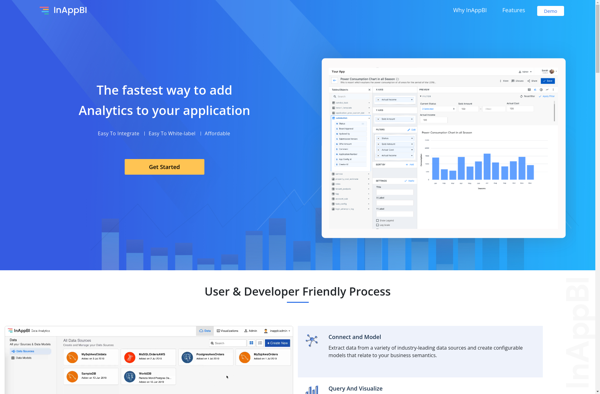
InAppBI is a business intelligence and analytics platform specifically designed for gathering insights from web and mobile applications. It allows developers to instrument their apps to capture event data and user behavior, which is processed by the InAppBI platform to generate interactive analytics dashboards and reports.Key capabilities and benefits of...
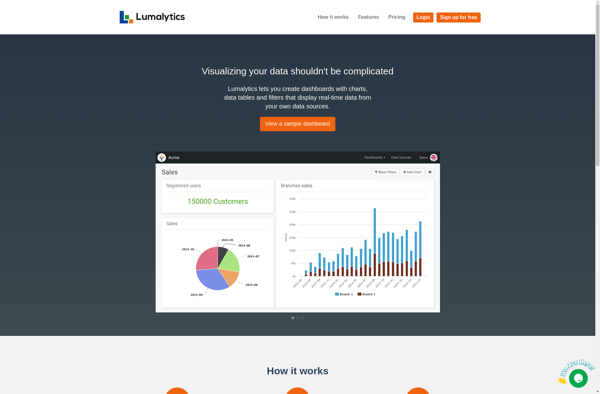
Lumalytics is a software platform built to provide analytics and business intelligence solutions tailored for the logistics industry. It focuses on connecting disparate data sources across the supply chain to give logistics companies enhanced visibility and actionable insights.Key features of Lumalytics include:Shipment tracking & visibility - Real-time tracking of shipments...