Pyramid Analytics is a business intelligence platform that enables users to create scalable data models, visual analytics and business insights. It combines self-service analytics with governed data discovery capabilities to empower employees and accelerate insights.
Pyramid Analytics is a business intelligence platform that enables users to create scalable data models, visual analytics and business insights. It combines self-service analytics with governed data discovery capabilities to empower employees and accelerate insights.
What is Pyramid Analytics?
Pyramid Analytics is an advanced business intelligence and analytics platform designed to empower organizations to make faster, more informed decisions. It combines governed self-service analytics capabilities with artificial intelligence-powered features to enable employees to easily access, explore, and act on governed data.
Key capabilities of Pyramid Analytics include:
Unified governed self-service analytics - Combines self-service data preparation, analytics and visualizations with centralized governance and security.
Scalable data modeling - Allows business users to develop enterprise semantic models and re-use them across analytics projects to accelerate time-to-insight.
Guided analytics - Uses AI and machine learning to guide users to insights and provides automated narration to speed time to discovery.
Mobile analytics - Enables access to analytics from any device and creates interactive mobile reports for on-the-go insights.
Natural language query - Allows users to ask questions of their data using conversational language to obtain answers and relevant visualizations.
Collaboration tools - Provides capabilities to annotate reports and visualizations, share content and have discussions to drive cross-functional alignment.
Pyramid Analytics is designed to enable organizations to build a data-driven culture by making insights more accessible. With its balance of self-service analytics and governance, scalable data modeling, and AI-powered features, it aims to accelerate time to value and improve business decisions through data.
Pyramid Analytics Features
Features
Self-service analytics
Governed data discovery
Scalable data models
Visual analytics
Business insights
Collaboration and sharing
Pricing
Subscription-Based
Pros
Comprehensive BI platform
Combines self-service and governed data discovery
Scalable and enterprise-ready
Robust data modeling and visualization capabilities
Collaborative features for sharing insights
Cons
Complex for non-technical users
Steep learning curve for some features
Pricing can be expensive for smaller organizations
Tableau is a leading business intelligence and data visualization platform used by organizations of all sizes to transform their data into easy-to-understand visualizations and dashboards. With Tableau, users can connect to a wide range of data sources, prepare and clean the data for analysis, and create interactive data visualizations such...
QlikView is a business intelligence and data visualization platform used to create interactive dashboards and analytics applications. It was first released in 1993 by the Swedish company Qlik. Key features of QlikView include:Associative data modeling and in-memory analytics engine - Allows fast analysis of large, disparate datasets without predefined schema...
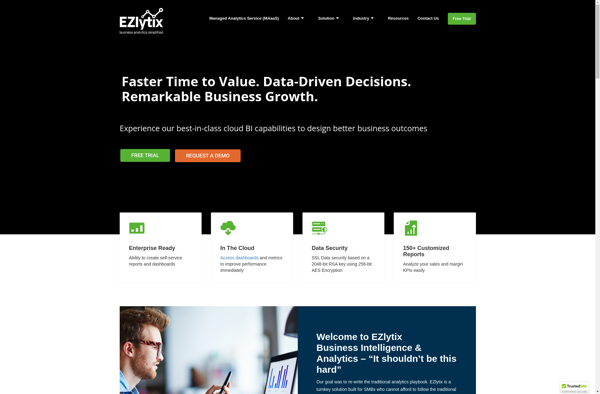
EZlytix is a business intelligence and data analytics software designed to help companies make data-driven decisions. It allows users to connect to various data sources, prepare and cleanse data, and create interactive dashboards and reports to gain insights.Some key features of EZlytix include:Intuitive drag-and-drop interface to build workflows, dashboards and...
QueryTree is a visual SQL analytics software designed to make query building fast and easy for any skill level. It features an intuitive drag-and-drop interface that allows users to construct complex SQL queries visually without typing code.Some key features of QueryTree include:Visual query builder with drag-and-drop fields and quick type...
Marple is an open-source, Markdown-based slide deck tool for creating presentations. It provides a minimalistic editor interface to write slide content in Markdown format, which then gets rendered into an elegant slide deck for presenting.Some key features of Marple:Write slide content in easy-to-read and write Markdown format. Format headings, lists,...
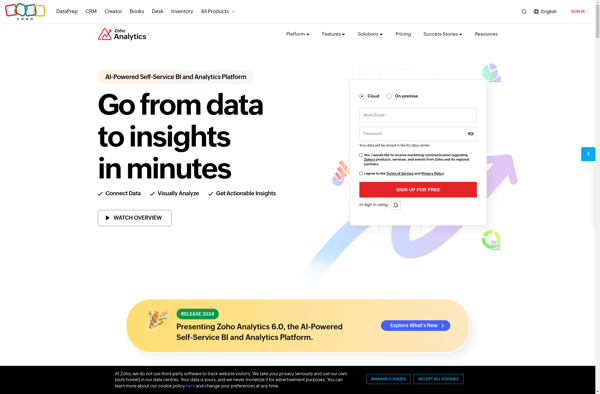
Zoho Analytics is a powerful yet user-friendly business intelligence and data analytics platform used by organizations of all sizes. It allows you to connect data from multiple sources including databases, cloud apps, and files, enabling a unified view of business data.With an intuitive drag-and-drop interface, Zoho Analytics makes it easy...
Birst is a cloud-native business intelligence and analytics platform used by enterprises to unify, understand, and act on data. Key capabilities and benefits include:Cloud data warehousing to bring together data from multiple sources for analysisInteractive dashboards and visualizations to spot trends and insightsSelf-service analytics empowering users across the organization to...
XLCubed is an Excel add-in designed specifically for financial analysts and modelers. It enhances Excel by providing commonly used financial functions, keyboard shortcuts, flexible graphing tools, and auditing features to improve model quality.Some of the key features of XLCubed include:Hundreds of financial and math functions like IRR, XNPV, XIRR, and...
YellowFin is an open-source autoML library for Python that automates the tuning of hyperparameters and model architecture search to help users achieve high accuracy with machine learning models. Developed by researchers at MIT, IIT, and Adobe Research, YellowFin aims to make state-of-the-art machine learning techniques accessible to non-experts.Some key capabilities...
ProClarity is a business intelligence and analytics software designed to help organizations make data-driven decisions. It provides an interactive dashboard and data visualization capabilities to easily analyze large datasets from multiple sources.Key features of ProClarity include:Drag-and-drop interface to quickly build dashboards and visualizationsBroad connectivity to import data from SQL Server,...
JReport is a business intelligence and reporting tool used to create interactive reports and dashboards from multiple data sources. It has an easy-to-use drag-and-drop interface that allows non-technical users to quickly build reports and visualize data without coding.Some key features of JReport include:Connecting to various databases, cloud apps, big data...
bipp Analytics is a business intelligence and data visualization software that empowers users to connect their data, analyze it visually, and extract meaningful insights. Some key features of bipp Analytics include:Data Connectors - Connect your data from databases, cloud apps, Excel, etc. with pre-built connectors.Interactive Dashboards - Build visually appealing,...