XLCubed is an Excel add-in for financial analysts to easily create financial models and analyze data. It provides commonly used financial functions, shortcuts, graphing tools and model auditing features.
XLCubed is an Excel add-in for financial analysts to easily create financial models and analyze data, providing commonly used financial functions, shortcuts, graphing tools, and model auditing features.
What is XLCubed?
XLCubed is an Excel add-in designed specifically for financial analysts and modelers. It enhances Excel by providing commonly used financial functions, keyboard shortcuts, flexible graphing tools, and auditing features to improve model quality.
Some of the key features of XLCubed include:
Hundreds of financial and math functions like IRR, XNPV, XIRR, and others for faster and more accurate calculations
Custom keyboard shortcuts that speed up navigation and formatting
Flexible charting with one-click plotting of results, scenario comparison, and chart formatting options
Auditing tools like model flow diagrams, checking for circular references, error tracing, and more to improve model robustness
By equipping analysts with specialized financial functions, productivity tools, and model quality checks, XLCubed aims to help financial modeling teams improve efficiency, minimize errors, and spend less time on tedious tasks. It works well for investment banking, private equity, corporate finance, and other analysts who regularly build and analyze financial models.
Microsoft Power BI is a powerful business analytics service developed by Microsoft. It empowers users to transform raw data into meaningful insights, create interactive reports and dashboards, and share data-driven stories within an organization. Power BI is designed to help businesses and individuals make informed decisions based on a comprehensive...
Tableau is a leading business intelligence and data visualization platform used by organizations of all sizes to transform their data into easy-to-understand visualizations and dashboards. With Tableau, users can connect to a wide range of data sources, prepare and clean the data for analysis, and create interactive data visualizations such...
QlikView is a business intelligence and data visualization platform used to create interactive dashboards and analytics applications. It was first released in 1993 by the Swedish company Qlik. Key features of QlikView include:Associative data modeling and in-memory analytics engine - Allows fast analysis of large, disparate datasets without predefined schema...
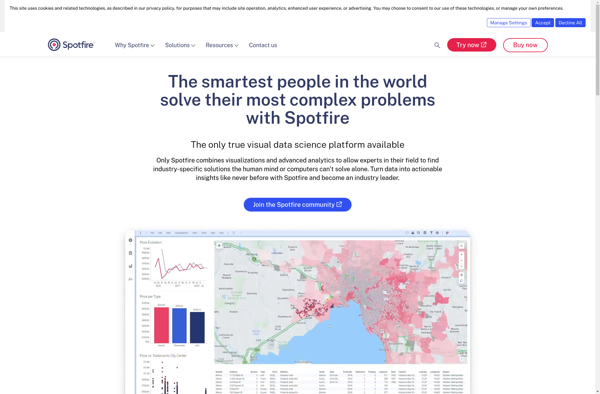
Spotfire is a business intelligence and analytics software platform designed for interactive data discovery and visualization. It enables rapid analysis of large, complex data sets to uncover deeper insights.Key features of Spotfire include:Interactive dashboards and visualizations - Drag-and-drop interface to create customized data visualizations like heat maps, charts, graphs, and...
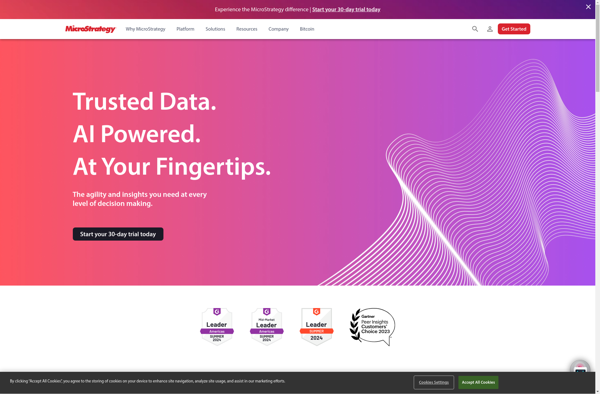
MicroStrategy is a leading enterprise analytics platform designed to help organizations make data-driven business decisions through advanced visualization and dashboarding capabilities. It serves as a one-stop solution for BI, allowing for data preparation, discovery, reporting, and predictive analytics.Key features of MicroStrategy include:Interactive dashboards and pixel-perfect reports that can be accessed...
QueryTree is a visual SQL analytics software designed to make query building fast and easy for any skill level. It features an intuitive drag-and-drop interface that allows users to construct complex SQL queries visually without typing code.Some key features of QueryTree include:Visual query builder with drag-and-drop fields and quick type...
Marple is an open-source, Markdown-based slide deck tool for creating presentations. It provides a minimalistic editor interface to write slide content in Markdown format, which then gets rendered into an elegant slide deck for presenting.Some key features of Marple:Write slide content in easy-to-read and write Markdown format. Format headings, lists,...
bipp Analytics is a business intelligence and data visualization software that empowers users to connect their data, analyze it visually, and extract meaningful insights. Some key features of bipp Analytics include:Data Connectors - Connect your data from databases, cloud apps, Excel, etc. with pre-built connectors.Interactive Dashboards - Build visually appealing,...
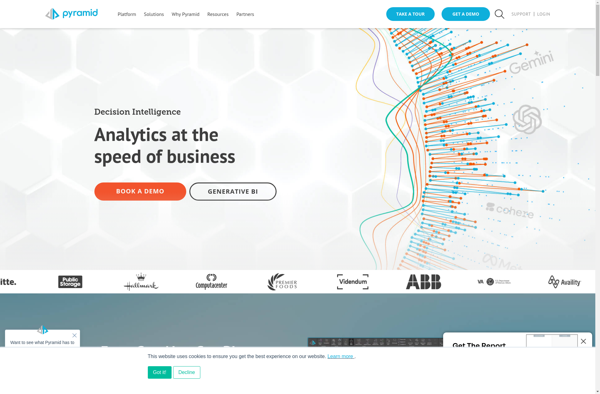
Pyramid Analytics is an advanced business intelligence and analytics platform designed to empower organizations to make faster, more informed decisions. It combines governed self-service analytics capabilities with artificial intelligence-powered features to enable employees to easily access, explore, and act on governed data.Key capabilities of Pyramid Analytics include:Unified governed self-service analytics...