Pine BI

Pine BI

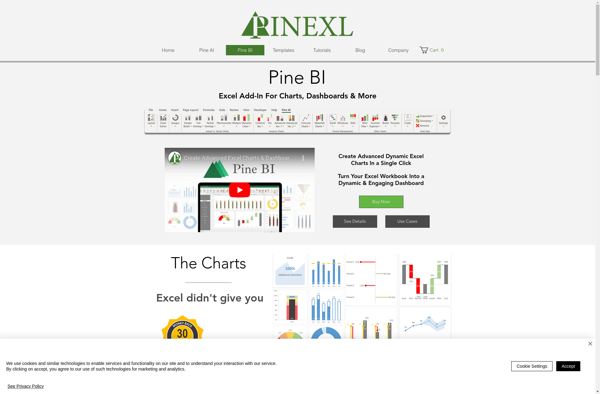
Pine BI is an open-source business intelligence and analytics platform. It provides tools for reporting, dashboards, ad-hoc analysis, and data visualization. Pine BI is lightweight, easy to use, and integrates with various data sources.
Pine BI image
reporting dashboards data-visualization adhoc-analysis open-source

Pine BI: Open-Source Business Intelligence Platform

Pine BI offers reporting, dashboards, ad-hoc analysis, and data visualization tools in a lightweight and easy-to-use open-source business intelligence platform, integrating with various data sources.

What is Pine BI?

Pine BI is an open-source business intelligence and analytics software that provides a suite of tools for reporting, dashboards, ad-hoc queries, and interactive data visualizations. It is designed to be lightweight, intuitive, and easy to integrate with multiple data sources.

Some key features of Pine BI include:

  • Drag-and-drop interface for building reports and dashboards
  • Support for connections to SQL databases, CSV files, REST APIs, and more
  • Interactive charts and graphs like bar, line, pie, scatter plots, pivot tables, and geospatial maps
  • Ad-hoc query editor for non-technical users to analyze data on the fly
  • Scheduled and automated report distribution via email and APIs
  • Role-based access control for managing users and permissions
  • Responsive design that adapts dashboard layouts for mobile and tablet devices

Pine BI is written in JavaScript and can be deployed on-premise or in the cloud. The open-source model allows for customizations and integration with other tools. It can be used by small, medium, and large organizations looking for an intuitive, self-serve analytics and reporting solution on a budget.

Pine BI Features

Features

  1. Drag-and-drop interface for building reports and dashboards
  2. Connects to various data sources like SQL, NoSQL, CSV, REST APIs
  3. Visualization options including charts, tables, gauges, maps
  4. Scheduled and ad-hoc reporting
  5. Collaboration through sharing of reports and dashboards
  6. Access control and user management
  7. Customizable themes

Pricing

  • Open Source

Pros

Free and open source

Easy to use

Lightweight and fast

Integrates with many data sources

Good for small to medium size businesses

Cons

Limited advanced analytics features

Not ideal for large enterprises

Lacks some complex visualization options

Not many 3rd party integrations

Limited mobile support


The Best Pine BI Alternatives

Top Business & Commerce and Business Intelligence & Analytics and other similar apps like Pine BI


Kutools for Excel icon

Kutools for Excel

Kutools for Excel is a powerful Excel add-in developed by Detong Technology Ltd. It provides over 300 advanced tools to help Excel users improve work efficiency by automating repetitive operations.Key features of Kutools for Excel include:Batch processing of Excel files such as compare, copy, delete, protect and unprotect sheetsAdvanced navigation...
Kutools for Excel image
GanttProject icon

GanttProject

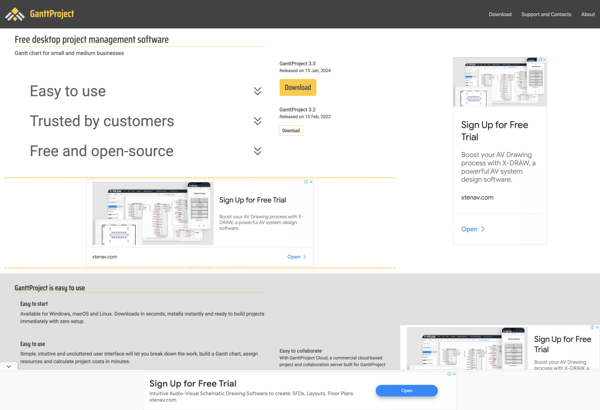
GanttProject is an open-source desktop application for project scheduling and management. It allows users to create Gantt charts to visualize project timelines and schedules. Key features include:Creating tasks and milestonesSetting task dependenciesAssigning resourcesTracking progressExporting charts to PDF or image filesGanttProject is designed for planning and tracking individual or team-based projects....
GanttProject image
Think-cell chart icon

Think-cell chart

think-cell is a software suite designed to simplify the creation of professional-looking charts and presentations, particularly within the Microsoft Office environment. It is known for its integration with Microsoft PowerPoint and Excel, providing tools to streamline the design and formatting of complex charts and visual elements. Key Features: Chart Creation:...
Think-cell chart image
Ultimate Dashboard Tools icon

Ultimate Dashboard Tools

Ultimate Dashboard Tools is a powerful WordPress plugin that enables you to create custom dashboards for your WordPress site. With its drag-and-drop interface, you can easily build dashboards tailored to your needs without any coding required.Some key features of Ultimate Dashboard Tools include:Over 50 customizable widgets covering analytics, sales, social...
Ultimate Dashboard Tools image
ASAP Utilities icon

ASAP Utilities

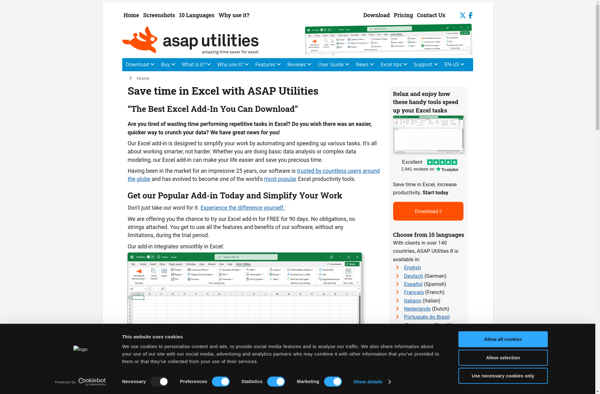
ASAP Utilities is an Excel add-in developed by Ablebits that provides a wide range of features and productivity tools for working with Excel workbooks and data. It installs directly into Excel to give you additional menu options and toolbar buttons.Key features of ASAP Utilities include:Merge and combine tables, split cells,...
ASAP Utilities image
Someka Excel Solutions icon

Someka Excel Solutions

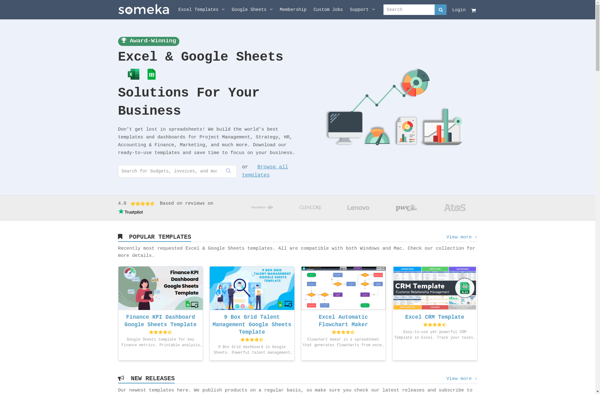
Someka Excel Solutions is an advanced Excel add-in designed to boost productivity for Excel power users, analysts, and teams. It provides a variety of features and tools to help automate repetitive tasks, analyze and visualize data, and streamline reporting in Excel.Key features include:Advanced reporting engine - Quickly generate complex reports...
Someka Excel Solutions image
PlusX Excel Add-In icon

PlusX Excel Add-In

PlusX Excel Add-In is an Excel add-on that enhances the capabilities of Microsoft Excel with a variety of additional tools and features. It helps boost productivity for Excel users by automating time-consuming tasks, providing better data visualization options, expanding available Excel functions, and more.Key features of PlusX Excel Add-In include:New...
Daniel’s XL Toolbox icon

Daniel’s XL Toolbox

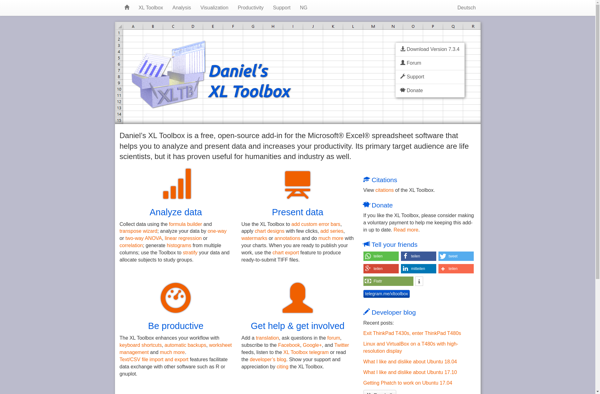
Daniel's XL Toolbox is an extensive Excel add-in that provides a variety of productivity tools and utilities to enhance Excel. Developed by Daniel Ferry, it aims to make working with Excel easier and faster.Some key features of Daniel's XL Toolbox include:Advanced Find & Replace - Find and replace across multiple...
Daniel’s XL Toolbox image
Devart Excel Add-ins icon

Devart Excel Add-ins

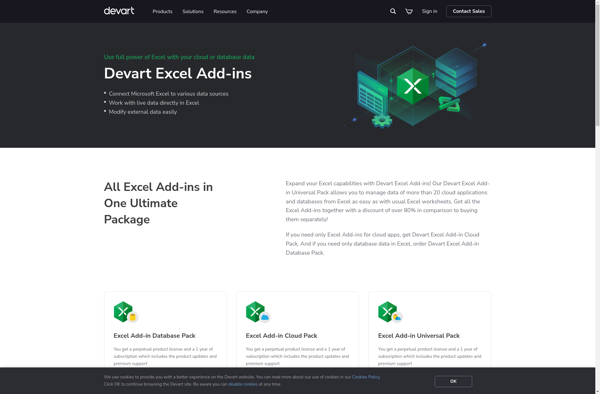
Devart Excel Add-ins are a suite of tools that enhance the capabilities of Excel by providing additional functionality through easy-to-use ribbons and dialog boxes. Some of the key features include:Importing and exporting data from various databases, files, and formats including SQL Server, MySQL, PostgreSQL, SQLite, and moreAdvanced formatting options like...
Devart Excel Add-ins image
FormulaDesk Navigator icon

FormulaDesk Navigator

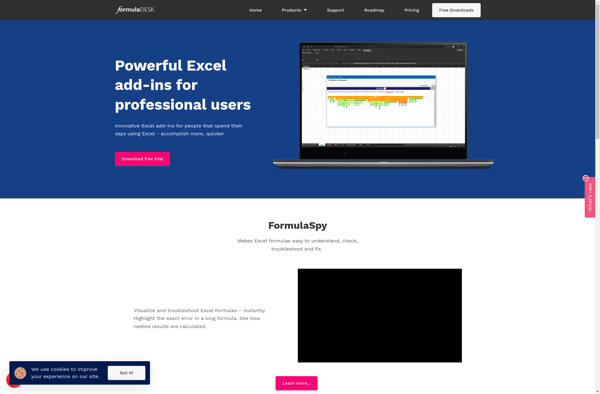
FormulaDesk Navigator is a specialized spreadsheet program designed for engineers, scientists, and other technical professionals. It comes packed with advanced mathematical, statistical, and matrix functions ideal for performing complex calculations, data analysis, and visualization.Some key features include:Powerful math engine that can handle complex formulas, linear algebra, differential equations, and moreAdvanced...
FormulaDesk Navigator image
FormulaDesk Math icon

FormulaDesk Math

FormulaDesk Math is a feature-rich math software for Windows designed to help you work with mathematical expressions, equations, functions, graphs, matrices, calculus, and more. It includes an equation editor, graphing calculator, matrix calculator, integral calculator, and other advanced mathematical tools.With FormulaDesk Math you can easily typeset and evaluate math formulas...
FormulaDesk Math image