GGobi
Description: GGobi is an open-source data visualization software used for interactive exploratory data analysis. It allows users to visualize high-dimensional datasets with scatterplots, parallel plots, tours, and dimension reduction methods like principal components analysis and grand tours.
Type: software
Pricing: Open Source
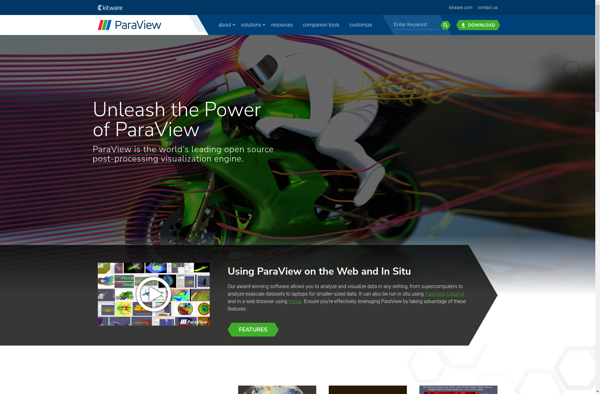
Paraview
Description: ParaView is an open-source, multi-platform data analysis and visualization application. It allows users to quickly build visualizations to analyze datasets using qualitative and quantitative techniques. The graphical user interface supports interactive visual exploration and the creation of basic filters and plots.
Type: software
Pricing: Open Source