Statpedia

Statpedia

Statpedia is a free online statistics glossary and guide to statistical concepts and methods. It provides clear definitions and examples for over 1,000 statistics terms and concepts.
glossary statistics reference

Statpedia: Free Online Statistics Glossary & Guide

A comprehensive online resource providing clear definitions and examples for over 1,000 statistical concepts and methods, all in one place.

What is Statpedia?

Statpedia is a comprehensive online resource for statistics and probability concepts. It features a searchable glossary with over 1,000 clear and concise definitions for statistical terminology along with relevant examples. Topics covered range from the basics of statistics like mean, median, mode, and standard deviation all the way to more advanced methods like ANOVA, regression analysis, hypothesis testing, and more.

One of the key goals of Statpedia is to make statistics more accessible and understandable to students, researchers, and anyone looking to brush up on statistical literacy. To that end, the site uses plain language explanations and real-world examples to elucidate core ideas. Formulas are accompanied by intuitive visualizations and step-by-step calculations to show how they work in practice.

In addition to definitions and explanations in the glossary, Statpedia also incorporates interactive tools like probability calculators and random number generators to help bring abstract statistical concepts to life. Practice questions and quizzes provide opportunities for site visitors to check their working knowledge of various topics. The site also highlights connections between related terms and concepts to reinforce learning.

Overall, Statpedia serves as both an introductory primer on key statistical fundamentals as well as handy reference guide for more experienced statistics users. With its comprehensive, easy-to-understand coverage of terminology, concepts, tools, and techniques, Statpedia aims to make the complex world of statistics a little more accessible.

Statpedia Features

Features

  1. Over 1,000 statistics terms and concepts explained
  2. Clear definitions and examples for statistics terminology
  3. Covers topics like probability, regression, sampling, and more
  4. Linked terms allow easy navigation between related concepts
  5. Searchable glossary to quickly find statistics definitions
  6. Ideal for students, researchers, and anyone interested in statistics

Pricing

  • Free

Pros

Completely free to use

Comprehensive statistics glossary

Accessible explanations of complex terms

Helpful for improving statistics knowledge

Well organized and easily searchable

Can aid in understanding statistics resources or courses

Cons

Lacks some advanced or obscure statistics terms

Definitions may not provide enough depth for some users

Does not cover detailed statistical procedures or calculations

Limited to text - no charts, graphs or other visuals

No practice problems or assessments for reinforced learning

Not regularly updated with new statistics terminology


The Best Statpedia Alternatives

Top Education & Reference and Statistics and other similar apps like Statpedia


Google Charts icon

Google Charts

Google Charts is a robust and flexible JavaScript charting and data visualization library provided for free by Google. It offers developers a highly customizable way to create interactive charts, graphs, and data tables that seamlessly integrate into web pages and applications.With Google Charts, you can visualize complex data sets and...
Google Charts image
Plotly icon

Plotly

Plotly is an open-source graphing library that allows users to create interactive, publication-quality graphs, charts, and dashboards. It supports Python, R, JavaScript, and Excel as programming languages. Some key features of Plotly include:Interactive visualization - Plotly charts are interactive with features like hover text, zooming, panning, selectable legends, and editable...
Plotly image
FusionCharts Suite XT icon

FusionCharts Suite XT

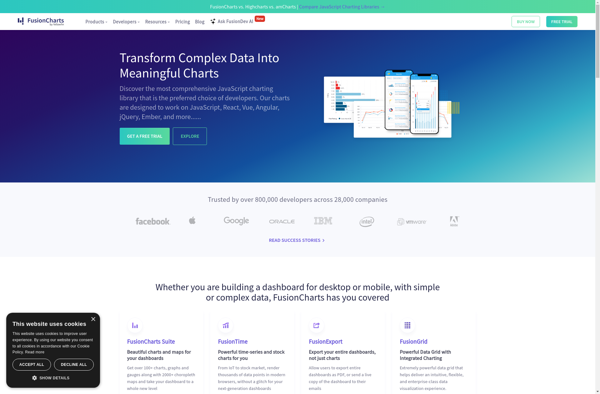
FusionCharts Suite XT is a comprehensive JavaScript charting solution that offers over 90 chart types including column, bar, pie, line, area, scatter, bubble charts and more. It also includes over 1100 maps including choropleth, markers, routes and more.Some key features of FusionCharts Suite XT:Interactive JavaScript charts, gauges and maps for...
FusionCharts Suite XT image
KoolChart icon

KoolChart

KoolChart is charting and data visualization software designed to enable users of all skill levels to easily create a wide variety of charts, graphs, and dashboards to display complex data. With its intuitive drag-and-drop interface, integrated analytics, and library of templates, KoolChart aims to make data visualization accessible for everyone.Some...
KoolChart image
ChartBlocks icon

ChartBlocks

ChartBlocks is a business intelligence and data visualization software used to create interactive charts, dashboards, and reports for better data analysis. It provides an easy drag-and-drop interface to build visualizations quickly without the need for coding.Some key features of ChartBlocks include:Drag-and-drop functionality to create various charts like bar, line, pie,...
ChartBlocks image
ZoomCharts icon

ZoomCharts

ZoomCharts is a feature-rich JavaScript charting library used to create interactive data visualizations for web applications and dashboards. With over 90 chart types to choose from, including line, bar, pie, map, scatter, and more, ZoomCharts provides the flexibility to represent data in a meaningful way.Some of the key capabilities and...
ZoomCharts image
Image Charts icon

Image Charts

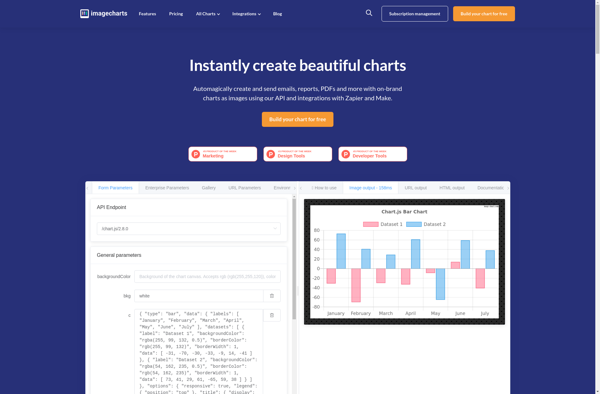
Image Charts is a powerful yet easy-to-use charting API for developers. It allows you to generate a wide variety of interactive charts and data visualizations simply by making API calls. Some key features of Image Charts:Supports over 20 highly customizable chart types including line, bar, pie, donut, area, heatmap and...
Image Charts image
ChartURL icon

ChartURL

ChartURL is an open-source data visualization and charting software used to create interactive visualizations from data. It can connect to various data sources like SQL databases, CSV files, REST APIs and more to import data and auto-generate charts and dashboards. Key features include:Intuitive drag-and-drop interface to build dashboardsSupport for multiple...
ChartURL image
Atlas charts icon

Atlas charts

Atlas charts is a data visualization and business intelligence software that provides an alternative to Tableau. It allows users to create interactive JavaScript charts, dashboards, and reports for data analysis and visualizations. Some key features of Atlas charts include:Drag and drop interface to build charts and dashboards quickly without codingSupport...
Atlas charts image
Chartico icon

Chartico

Chartico is a cloud-based data visualization and business intelligence software that allows users to easily create interactive charts, dashboards and reports from their data. Some key features of Chartico include:Drag-and-drop interface to build charts, dashboards and reports visually without codingConnect to data from SQL, MongoDB, Excel, CSVs and other sources...
Chartico image