Image Charts
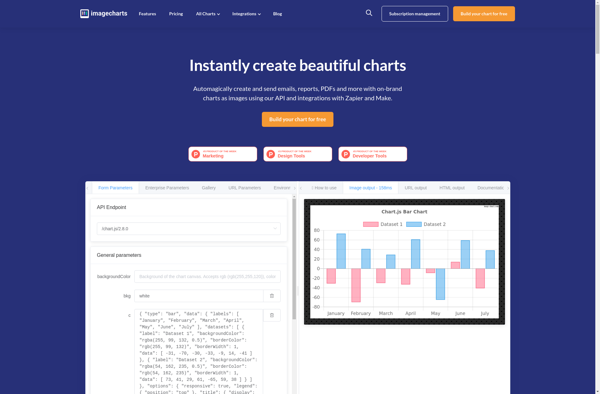
Image Charts is a charting API that allows you to generate charts, graphs and other data visualizations by making simple API calls. It supports over 20 chart types including line, bar, pie and more.

Image Charts: Powerful Charting API for Data Visualization
Generate charts, graphs, and data visualizations with our easy-to-use charting API, supporting over 20 chart types.
What is Image Charts?
Image Charts is a powerful yet easy-to-use charting API for developers. It allows you to generate a wide variety of interactive charts and data visualizations simply by making API calls. Some key features of Image Charts:
- Supports over 20 highly customizable chart types including line, bar, pie, donut, area, heatmap and more
- Chart images can be embedded into web and mobile applications using auto-generated image URLs or Base64 encoded strings
- Real-time chart updates - charts get regenerated every time the underlying data changes
- Extensive styling options to customize colors, labels, fonts, legends and more as per your branding
- Annotations and markers to highlight specific data points or ranges
- Supports dynamic variables, custom labels and number formatting
- Handles big data sets with up to millions of data points
- Free tier to get started with up to 500 charts per month
- Paid plans for high-traffic sites with unlimited charts
With its ease-of-use and flexibility, Image Charts is a great choice to create stunning data visualizations for dashboards, reports, analytics and more.
Image Charts Features
Features
- Supports over 20 chart types including line, bar, pie, scatter plots etc
- Can generate charts as PNG, JPEG or SVG images
- Has APIs for various languages like Python, PHP, Ruby, Node.js etc
- Offers customizable styling options for charts
- Has URL API to generate charts from query parameters
- Provides APIs to embed charts in web and mobile apps
- Has helper libraries for integration with frameworks like Django, Rails etc
Pricing
- Freemium
- Pay-As-You-Go
Pros
Simple and easy to use API
Good documentation and examples
Large variety of chart types supported
Multiple output formats supported
Customizable styling and configuration
APIs for major languages and frameworks
Free tier available
Cons
Limited chart customization in free tier
No advanced chart types like heatmaps, treemaps etc
Not many options for interactivity and animations
No native support for dashboards or reporting
Requires internet access to generate charts
Official Links
Reviews & Ratings
Login to ReviewThe Best Image Charts Alternatives
Top Ai Tools & Services and Data Visualization and other similar apps like Image Charts
Here are some alternatives to Image Charts:
Suggest an alternative ❐Google Charts
Google Charts is a robust and flexible JavaScript charting and data visualization library provided for free by Google. It offers developers a highly customizable way to create interactive charts, graphs, and data tables that seamlessly integrate into web pages and applications.With Google Charts, you can visualize complex data sets and...

ChartURL
ChartURL is an open-source data visualization and charting software used to create interactive visualizations from data. It can connect to various data sources like SQL databases, CSV files, REST APIs and more to import data and auto-generate charts and dashboards. Key features include:Intuitive drag-and-drop interface to build dashboardsSupport for multiple...

Statpedia
Statpedia is a comprehensive online resource for statistics and probability concepts. It features a searchable glossary with over 1,000 clear and concise definitions for statistical terminology along with relevant examples. Topics covered range from the basics of statistics like mean, median, mode, and standard deviation all the way to more...
