CiCiUI Chart is an open-source JavaScript charting library for building interactive charts and graphs. It offers a wide variety of chart types including line, bar, pie, donut, scatter, and more. Key features include responsiveness, theming, animation, and rich customization optio
CiCiUI Chart is an open-source JavaScript charting library for building interactive charts and graphs. It offers a wide variety of chart types including line, bar, pie, donut, scatter, and more. Key features include responsiveness, theming, animation, and rich customization options.
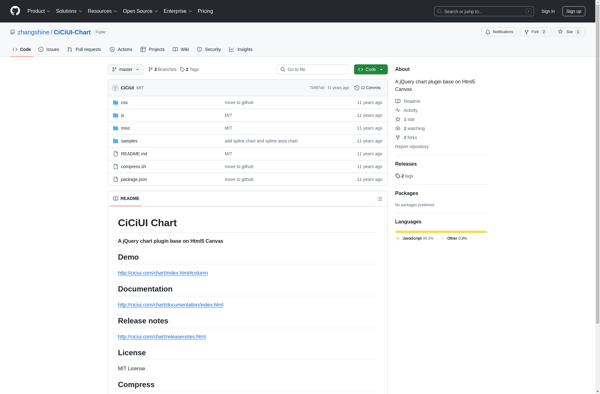
What is CiCiUI Chart?
CiCiUI Chart is a feature-rich JavaScript charting library built on HTML5 Canvas element. It allows developers to easily create highly customizable, interactive charts and graphs and embed them into web pages and applications.
Some key features and capabilities of CiCiUI Chart include:
Supports a wide variety of chart types out of the box including line, bar, pie, donut, radar, polar area, bubble, scatter, etc.
Charts are responsive and auto-resize based on screen sizechanges.
Extensive customization options for colors, labels, tooltips, animation, etc.
Touch-friendly charts with pinch/zoom, panning, tooltip on tap features.
Canvas-based rendering for high performance.
Lightweight at just around 100KB gzipped.
MIT license for free commercial use.
CiCiUI Chart has an easy-to-use syntax and API that makes it simple for developers to get started. Charts can be created declaratively by specifying chart options or imperatively through the Chart class interface. There are also numerous plugins and samples available to add advanced features like zooming, annotations, data streaming, and more.
With its free usage license, small size, rich features and customizability, CiCiUI Chart is a great option for incorporating interactive, dynamic charts and graphs into web and mobile applications.
Google Charts is a robust and flexible JavaScript charting and data visualization library provided for free by Google. It offers developers a highly customizable way to create interactive charts, graphs, and data tables that seamlessly integrate into web pages and applications.With Google Charts, you can visualize complex data sets and...
Highcharts is an advanced JavaScript charting library used to visualize data and create interactive charts and graphs in web applications. Originally developed in 2009 by Highsoft AS, Highcharts allows developers to quickly add charts and graphs to their web pages with support for a wide variety of chart types out...
CanvasJS Charts is a feature-rich JavaScript HTML5 charting library that enables interactive charts, graphs and data visualizations in web applications and sites. It is free for non-commercial use and offers over 30 different chart types including line, area, column, bar, pie, doughnut, funnel, polar, radar, range and more.Some key features...
FusionCharts Suite XT is a comprehensive JavaScript charting solution that offers over 90 chart types including column, bar, pie, line, area, scatter, bubble charts and more. It also includes over 1100 maps including choropleth, markers, routes and more.Some key features of FusionCharts Suite XT:Interactive JavaScript charts, gauges and maps for...
Charts 4 PHP is an open-source and free PHP charting library that allows developers to create interactive charts, graphs and data visualizations using PHP. It provides an easy way to visualize data on web applications and sites built with PHP.Some key features of Charts 4 PHP:Supports various chart types including...
liveGap Charts is an open-source JavaScript charting library used to build customizable, interactive data visualizations for the web. Developed by liveGap's engineering team, it was designed to provide an intuitive way to visualize data and create rich user experiences.Some key features of liveGap Charts include:Support for a wide variety of...
RGraph is an open source JavaScript charting library that allows developers to add interactive, customizable charts and graphs to web pages without needing a charting server backend. It is lightweight, easy to implement, and supports over 30 chart types including line, bar, pie, scatter, waterfall, funnel charts and more.Some key...
ChartURL is an open-source data visualization and charting software used to create interactive visualizations from data. It can connect to various data sources like SQL databases, CSV files, REST APIs and more to import data and auto-generate charts and dashboards. Key features include:Intuitive drag-and-drop interface to build dashboardsSupport for multiple...
PykCharts.js is an open source JavaScript charting library for building highly customizable and interactive data visualizations and charts using web technologies. It is built on top of the popular D3.js library.Key features of PykCharts include:Support for various chart types like line, bar, pie, donut, scatter, bubble maps etc.Interactive charts with...
CanvasXpress is an open-source JavaScript data visualization library designed for interactive data graphing and analysis. It allows researchers and developers to create a wide variety of highly customizable data visualizations including bar charts, pie charts, dot plots, heatmaps, scatter plots, box plots, histograms, line plots, network diagrams and more.Some key...