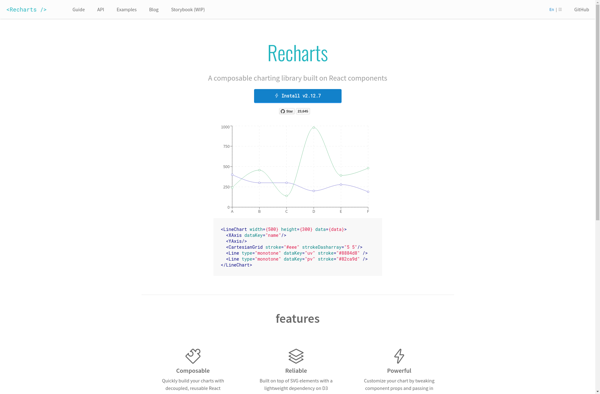
Recharts is a popular React charting library for building data visualizations. It offers many customizable chart types including line, bar, pie, radar, treemap and more. Recharts is easy to use, responsive, interactive and leverages SVG for rendering.
Recharts: A Highly Customizable React Charting Library
A popular React charting library with customizable chart types, Recharts offers a responsive, interactive, and easy-to-use data visualization solution leveraging SVG for rendering.
What is Recharts?
Recharts is an open-source React charting library used to build various data visualizations and interactive charts. It is Declarative, Component-Based, and highly customizable to create charts such as line, bar, pie, radar, scatter, treemap and more.
Some key features of Recharts:
Supports both SVG and Canvas rendering using a unified API
Responsive design and mobile-friendliness out of the box
Hooks for state management integration (useState, useEffect etc)
Isomorphic support for server-side rendering
Animation and interactive events support
Customizable axes, legends, tooltips
Svg based vector graphics leading to high performance
Easily customizable themes
Integration with React and TypeScript
Recharts stands out due to its React-focused API, extensive browser compatibility, performance and ease of use. It has a thriving open-source community behind it providing long-term reliability. Companies like Uber, Atlassian, GoDaddy use it to build analytics dashboards and data-driven apps.
Recharts Features
Features
Supports various chart types like line, bar, pie, radar, scatter, treemap etc
Offers responsive and interactive charts
Supports SVG based rendering for better performance
Highly customizable with props for charts, axes, legends, tooltips etc
Isomorphic/Universal - server side rendering support
Works with React Native
Hooks API available
Good documentation
Pricing
Open Source
Pros
Open source and free
Easy to use and integrate
Good performance
Very customizable
Supports animation and interactivity
Large number of examples and components
Active development and maintenance
Cons
Less chart types compared to some commercial libraries
Steeper learning curve than wrappers like react-chartjs-2
Google Charts is a robust and flexible JavaScript charting and data visualization library provided for free by Google. It offers developers a highly customizable way to create interactive charts, graphs, and data tables that seamlessly integrate into web pages and applications.With Google Charts, you can visualize complex data sets and...
Plotly is an open-source graphing library that allows users to create interactive, publication-quality graphs, charts, and dashboards. It supports Python, R, JavaScript, and Excel as programming languages. Some key features of Plotly include:Interactive visualization - Plotly charts are interactive with features like hover text, zooming, panning, selectable legends, and editable...
Highcharts is an advanced JavaScript charting library used to visualize data and create interactive charts and graphs in web applications. Originally developed in 2009 by Highsoft AS, Highcharts allows developers to quickly add charts and graphs to their web pages with support for a wide variety of chart types out...
CanvasJS Charts is a feature-rich JavaScript HTML5 charting library that enables interactive charts, graphs and data visualizations in web applications and sites. It is free for non-commercial use and offers over 30 different chart types including line, area, column, bar, pie, doughnut, funnel, polar, radar, range and more.Some key features...
Chart.js is an open-source JavaScript library that allows developers to easily create responsive, interactive data visualizations and charts using HTML5 Canvas. Some key things to know about Chart.js:Supports 8 chart types out of the box: line, bar, radar, polar, pie, doughnut, scatter, and bubble chartsUses HTML5 Canvas for rendering charts,...
NVD3 is an open-source JavaScript charting library used to build interactive data visualizations in web browsers. It is based on D3.js and reuses parts of the D3 codebase to create reusable charts. NVD3 aims to simplify and streamline D3 code for faster web development.Some key features of NVD3 include:Over a...
Bokeh is an open-source Python library for creating interactive data visualizations for modern web browsers. It allows users to quickly construct versatile and high-performance graphics from simple plots to complex dashboards. Some key features of Bokeh include:Integration with common Python data science libraries like NumPy, Pandas, Scikit-Learn for easy data...
Amazon QuickSight is a fast, cloud-powered business intelligence service that makes it easy to build visualizations, perform ad-hoc analysis, and quickly get business insights from your data. Some key features include:Intuitive visual interface that makes it easy to visualize and explore dataBroad data connectivity to connect to data sources like...
Processing.js is an open-source JavaScript port of the popular Processing visualization programming language and environment. It allows web browsers to display animations, visualizations, and interactions using the Processing syntax and graphical capabilities.Some key features of Processing.js include:Works with modern web browsers like Chrome, Firefox, and SafariSupports 2D and 3D graphics,...
Frappé Charts is an open source data visualization library built on Python and JavaScript. It offers a wide variety of interactive charts and graphs including line, area, bar, pie, donut, scatter, heat maps and more. The key features of Frappé Charts include:Simple and intuitive drag-and-drop interface to create visualizationsSupport for...
RAWGraphs is a free, open-source web tool created for anyone to easily visualize and share data using the most common graphical formats. The simple drag and drop interface makes it easy for non-experts to quickly generate a wide variety of charts and diagrams that can be exported and shared as...