Ggvis
ggvis is an R package for creating interactive data visualizations and graphics in a web browser. It builds on the popular ggplot2 package but allows users to add interactivity, make visualizations reusable, and embed them in web pages.

ggvis: Create Interactive Data Visualizations
ggvis is an R package for creating interactive data visualizations and graphics in a web browser. It builds on the popular ggplot2 package but allows users to add interactivity, make visualizations reusable, and embed them in web pages.
What is Ggvis?
ggvis is an R package developed by RStudio for building interactive data visualizations. It allows users to create rich graphics and plots that can be embedded in web pages and applications. Some key features of ggvis include:
- Builds on the popular ggplot2 graphics package in R, so it is easy for ggplot2 users to start using ggvis
- Interactivity - ggvis visualizations allow the end user to interact with the graphic by panning, zooming, hovering, filtering, and more
- Reusable components - ggvis graphics can be packaged into reusable building blocks that allow modular construction of complex visualizations
- Integration with Shiny - ggvis works seamlessly with Shiny web applications for R
- Exporting and embedding - visualizations can be exported as Vega-Lite JSON or embedded directly into web pages as iframes or via custom bindings
In summary, ggvis allows R users to create D3-style interactive web graphics easily by building on their existing knowledge of ggplot2. It enables powerful data exploration and presentation from within R.
Ggvis Features
Features
- Grammar of Graphics-based visualization using the ggplot2 API
- Interactivity through linking graphical elements to data
- Built on top of Shiny for reactive programming
- Can embed plots in R Markdown documents and Shiny apps
- Supports faceting, zooming, panning, etc.
- Exporting plots to SVG and PNG format
Pricing
- Open Source
Pros
Leverages ggplot2 syntax for easy plotting
Interactivity enables exploration of data
Tight integration with Shiny apps
Can create standalone visualizations to embed in web pages
Cons
Limited adoption compared to static ggplot2
Interactivity requires knowledge of reactivity in Shiny
Less customizable than D3.js for web-based graphics
Official Links
Reviews & Ratings
Login to ReviewThe Best Ggvis Alternatives
Top Data Visualization and Interactive Graphics and other similar apps like Ggvis
Here are some alternatives to Ggvis:
Suggest an alternative ❐Tableau
Tableau is a leading business intelligence and data visualization platform used by organizations of all sizes to transform their data into easy-to-understand visualizations and dashboards. With Tableau, users can connect to a wide range of data sources, prepare and clean the data for analysis, and create interactive data visualizations such...

Plotly
Plotly is an open-source graphing library that allows users to create interactive, publication-quality graphs, charts, and dashboards. It supports Python, R, JavaScript, and Excel as programming languages. Some key features of Plotly include:Interactive visualization - Plotly charts are interactive with features like hover text, zooming, panning, selectable legends, and editable...

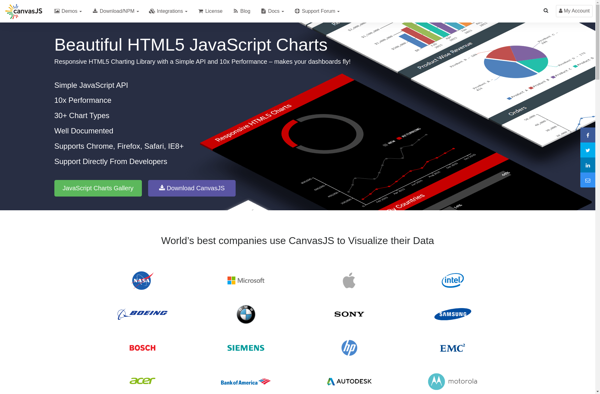
CanvasJS Charts
CanvasJS Charts is a feature-rich JavaScript HTML5 charting library that enables interactive charts, graphs and data visualizations in web applications and sites. It is free for non-commercial use and offers over 30 different chart types including line, area, column, bar, pie, doughnut, funnel, polar, radar, range and more.Some key features...

ChartBlocks
ChartBlocks is a business intelligence and data visualization software used to create interactive charts, dashboards, and reports for better data analysis. It provides an easy drag-and-drop interface to build visualizations quickly without the need for coding.Some key features of ChartBlocks include:Drag-and-drop functionality to create various charts like bar, line, pie,...

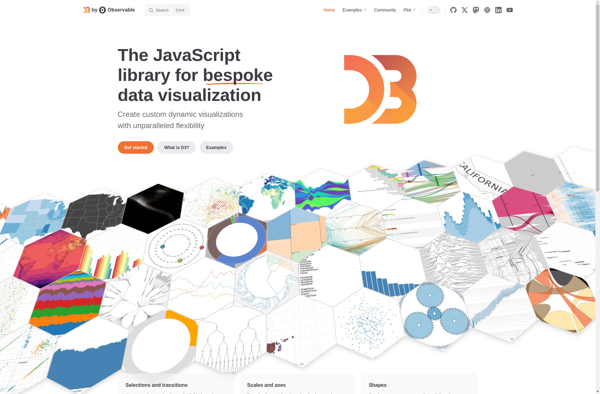
D3.js
D3.js, or D3, is an open-source JavaScript library used for visualizing data with web standards. D3 stands for Data-Driven Documents. It allows developers to bind arbitrary data to the Document Object Model (DOM) and then apply data-driven transformations to the document. This allows web developers to create dynamic, interactive data...

C3.js
C3.js is an open-source JavaScript library for generating clear and attractive charts. It is a wrapper built on top of D3.js that simplifies common chart types like line, bar, pie, scatter, stacked graphs, etc. The goal is to provide an easy way for web developers to visualize data without writing...

NVD3
NVD3 is an open-source JavaScript charting library used to build interactive data visualizations in web browsers. It is based on D3.js and reuses parts of the D3 codebase to create reusable charts. NVD3 aims to simplify and streamline D3 code for faster web development.Some key features of NVD3 include:Over a...

Dc.js
dc.js is a JavaScript charting library that leverages d3.js and crossfilter for interactive dimensional charting and visual analysis of large datasets. Some key features of dc.js include:Integration with d3.js for powerful and flexible visualizationsTight integration with crossfilter for fast filtering and grouping of large datasetsFocus+Context and Brushing chart interactionsAnimated transitions...

Bokeh
Bokeh is an open-source Python library for creating interactive data visualizations for modern web browsers. It allows users to quickly construct versatile and high-performance graphics from simple plots to complex dashboards. Some key features of Bokeh include:Integration with common Python data science libraries like NumPy, Pandas, Scikit-Learn for easy data...

Vis.js
Vis.js is an open source data visualization library built with JavaScript. It allows developers to create interactive visualizations such as timelines, networks and graphs easily in the browser using web standards.Some of the key features of Vis.js include:Various data visualization modules for timelines, networks, graphs etc.Easily customizable and extensible to...

Matplotlib
Matplotlib is a comprehensive 2D plotting library for Python that enables users to create a wide variety of publication-quality graphs, charts, and visualizations. It supports many basic and advanced plotting functionalities and integrates well with NumPy and Pandas data structures.Matplotlib can be used to visualize data in a variety of...

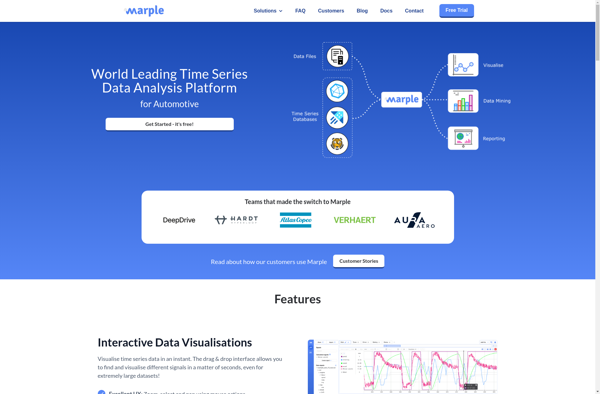
Marple
Marple is an open-source, Markdown-based slide deck tool for creating presentations. It provides a minimalistic editor interface to write slide content in Markdown format, which then gets rendered into an elegant slide deck for presenting.Some key features of Marple:Write slide content in easy-to-read and write Markdown format. Format headings, lists,...
