Matplotlib

Matplotlib: Comprehensive 2D Plotting Library
A Python library for creating publication-quality graphs, charts, and visualizations, integrating well with NumPy and Pandas data structures.
What is Matplotlib?
Matplotlib is a comprehensive 2D plotting library for Python that enables users to create a wide variety of publication-quality graphs, charts, and visualizations. It supports many basic and advanced plotting functionalities and integrates well with NumPy and Pandas data structures.
Matplotlib can be used to visualize data in a variety of 2D plots including line plots, bar charts, histograms, scatter plots, area plots, pie charts, etc. It provides a MATLAB-style interface, state-based interface, and an object-oriented interface for building plots. Some key features include support for NumPy arrays, automatic plot generation, customization of all plot elements, LaTeX integration for mathematical expressions, built-in animations, and easy saving of plots in various file formats.
It is an extremely flexible and highly customizable tool that works well for prototyping visualizations, creating graphs for reports/papers, data analysis, and machine learning model visualization. Matplotlib can generate plots, histograms, power spectra, bar charts, errorcharts, scatterplots, etc., with just a few lines of code.
Matplotlib Features
Features
- 2D plotting
- Publication quality output
- Support for many plot types (line, bar, scatter, histogram etc)
- Extensive customization options
- IPython/Jupyter notebook integration
- Animations and interactivity
- LaTeX support for mathematical typesetting
Pricing
- Open Source
Pros
Cons
Official Links
Reviews & Ratings
Login to ReviewThe Best Matplotlib Alternatives
View all Matplotlib alternatives with detailed comparison →
Top Photos & Graphics and Data Visualization and other similar apps like Matplotlib
Here are some alternatives to Matplotlib:
Suggest an alternative ❐MATLAB
GeoGebra

GnuPlot

Plotly

NumeRe

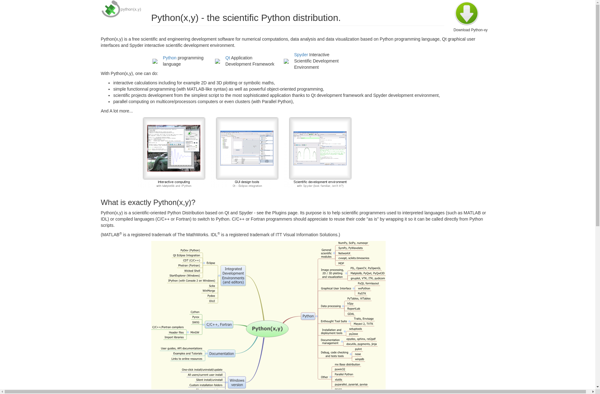
Python(x,y)
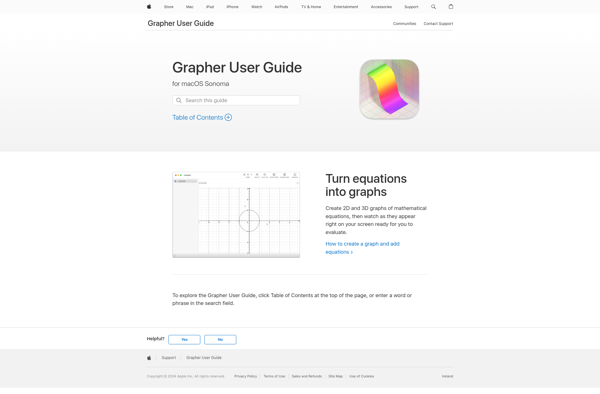
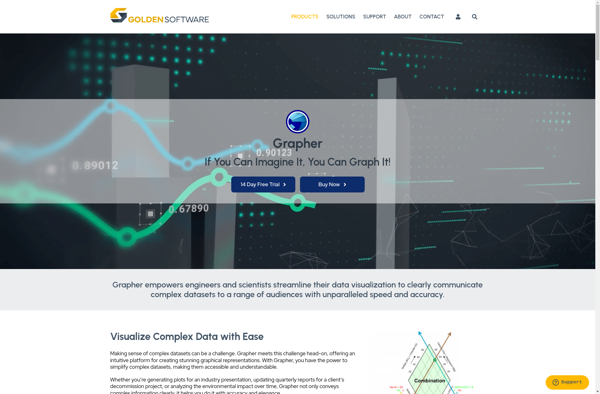
Grapher
Microsoft Mathematics
SciDaVis

Golden Software Grapher
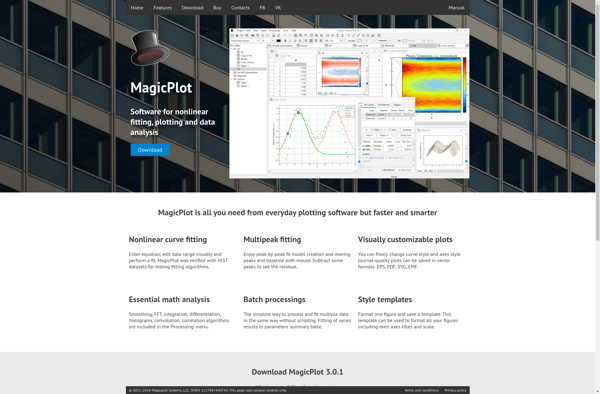
MagicPlot
GraphCalc
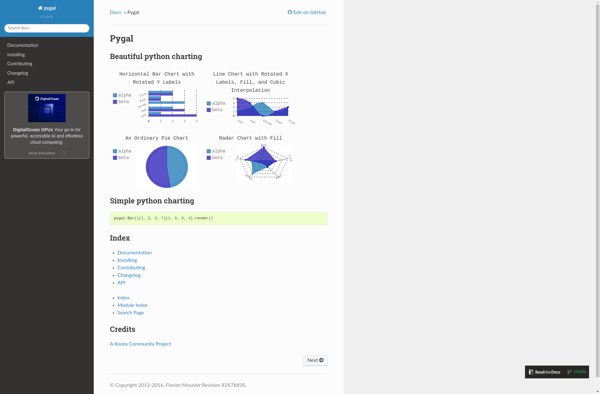
Pygal
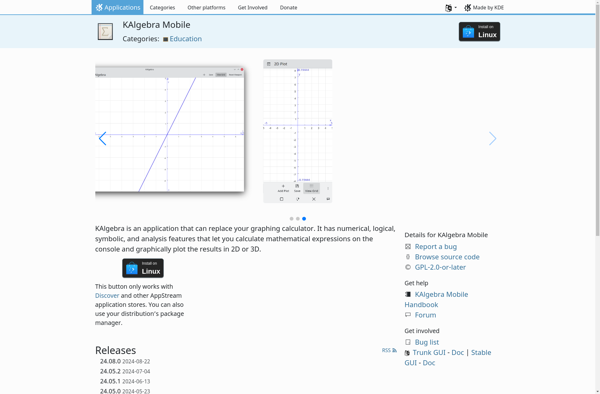
KAlgebra
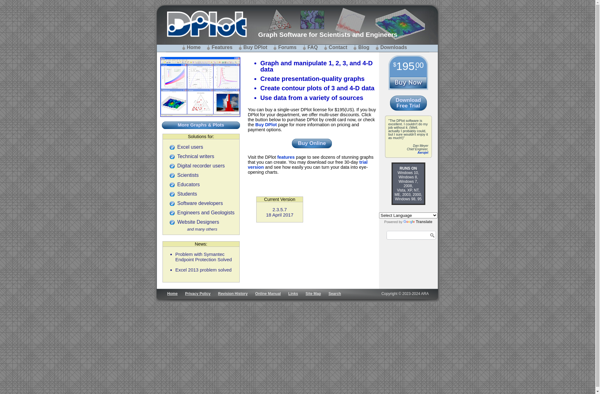
DPlot
Bokeh

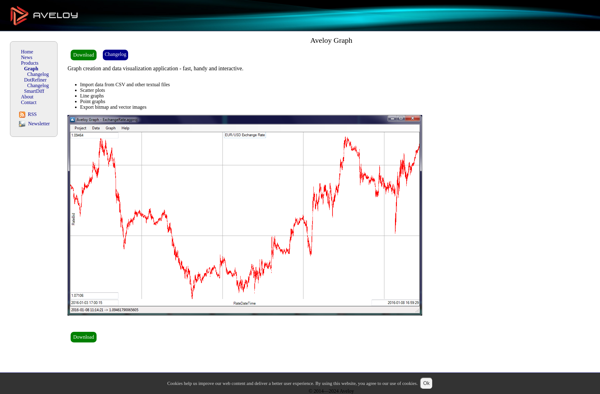
Aveloy Graph
Graphmatica

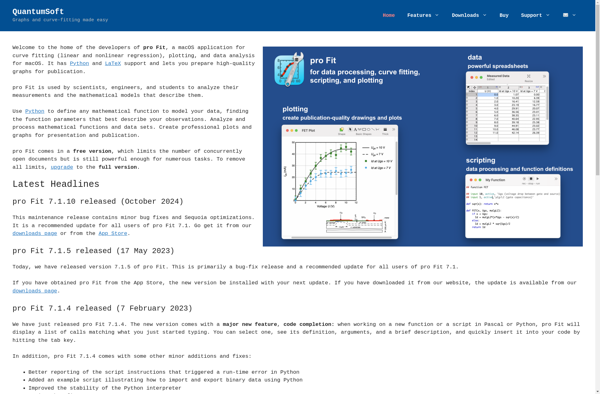
Pro Fit
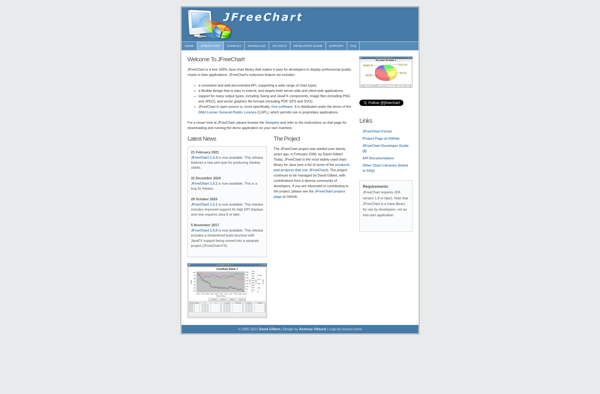
JFreeChart
Giac/Xcas

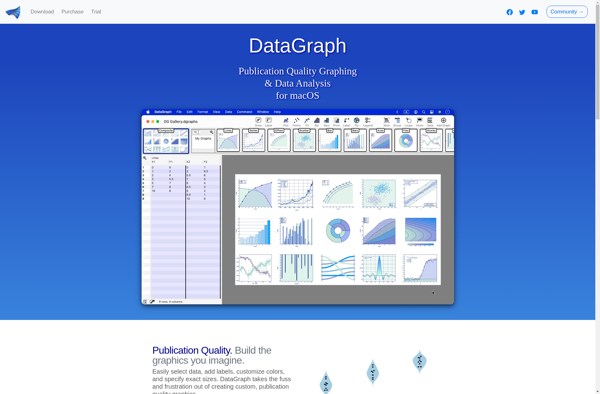
DataGraph
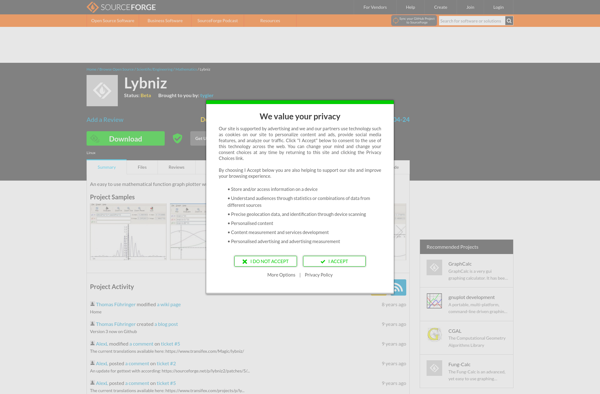
Lybniz
RGraph

Autograph

HARFANG 3D

Dash Reports
LabPlot

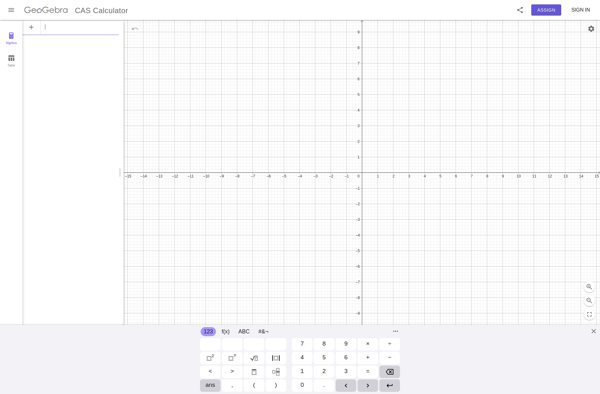
GeoGebra CAS Calculator
Ggvis

Core Plot
MagicPlot Viewer

Timeplotters