GeoGebra

GeoGebra

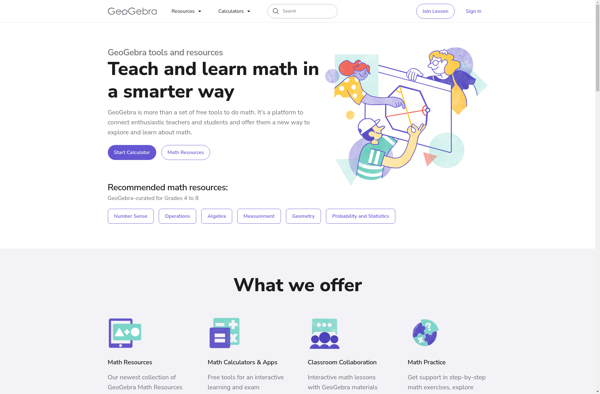
GeoGebra is free and open-source dynamic mathematics software for all levels of education. It combines geometry, algebra, spreadsheets, graphing, statistics and calculus in one easy-to-use package. It can be used to teach math from elementary through university level.
GeoGebra image
geometry algebra spreadsheets graphing statistics calculus math education

GeoGebra: Free & Open-Source Dynamic Mathematics Software

GeoGebra combines geometry, algebra, spreadsheets, graphing, statistics and calculus in one easy-to-use package for all levels of education, from elementary through university level.

What is GeoGebra?

GeoGebra is a free, open-source dynamic mathematics software that can be used for teaching and learning mathematics at all levels of education. It combines geometry, algebra, spreadsheets, graphing, statistics and calculus in one easy-to-use and well-integrated package making it an excellent tool for demonstrating mathematical concepts.

Some of the key features of GeoGebra include:

  • Graphing functions, inequalities, conic sections
  • 3D graphing capabilities
  • Animated geometry constructions
  • Calculators for derivatives, integrals, matrices and more
  • Tools for data analysis and statistics
  • Dynamic slider inputs
  • Extensive customization options

GeoGebra has applications in teaching subjects like geometry, algebra, trigonometry, calculus as well as statistics and physics. Its flexibility allows it to be used for activities ranging from simple arithmetic to advanced differential equations. GeoGebra can help demonstrate mathematical concepts visually and interactively, engaging students’ interest.

The software is translated into multiple languages and has a large user community with extensive resources available for teachers. It can be used online through the web browser as well as installed offline on Windows, Mac and Linux systems. GeoGebra is an excellent, free alternative to similar commercial mathematical software options.

GeoGebra Features

Features

  1. Interactive geometry
  2. Algebra and calculus tools
  3. Spreadsheets
  4. Dynamic graphs
  5. Statistics and probability tools
  6. 3D graphics

Pricing

  • Free
  • Open Source

Pros

Free and open source

Available on multiple platforms

Extensive materials and tutorials

Active user community

Supports multiple languages

Cons

Steep learning curve

Limited customization options

Occasional bugs and stability issues

Lacks some advanced features of paid alternatives


The Best GeoGebra Alternatives

Top Education & Reference and Math & Science and other similar apps like GeoGebra


Desmos icon

Desmos

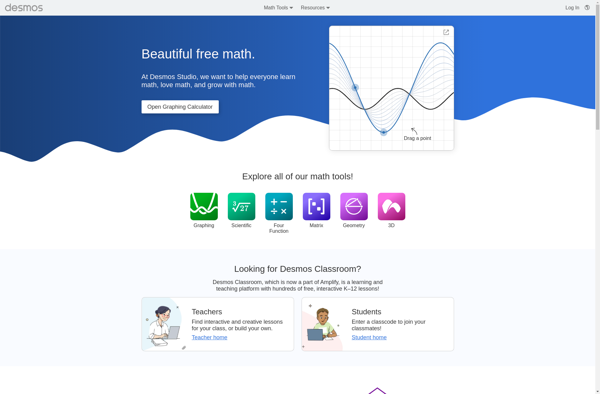
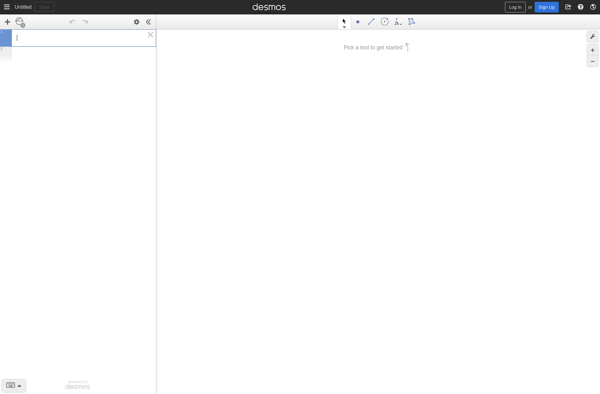
Desmos is an online graphing calculator and geometry tool used by students, teachers, and professionals in math, science, engineering, business, and more. It allows users to quickly visualize mathematical functions, equations, inequalities, and data sets with an easy-to-use web interface and mobile apps for iOS and Android.Key features of Desmos...
Desmos image
GnuPlot icon

GnuPlot

GnuPlot is a powerful, stable and free scientific graphing package with advanced capabilities. Developed originally for Unix-like operating systems, GnuPlot is now available for Windows, macOS and Linux.It can produce high-quality graphical visualizations of data from files or stdin, including simple x-y plots, histograms, contour plots, mesh plots, polar plots,...
GnuPlot image
Derive icon

Derive

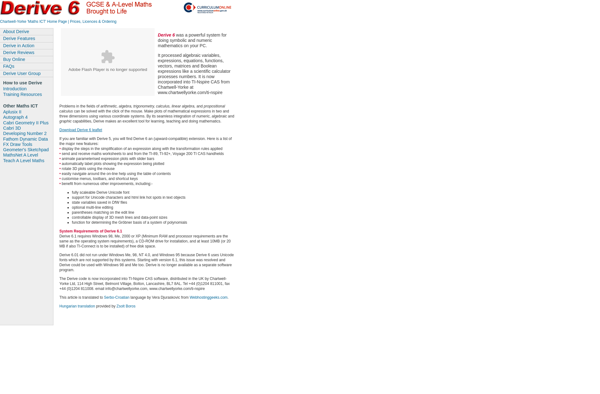
Derive is a mathematical and graphical software program used for symbolic and numeric manipulation and visualization of mathematical expressions. Originally released in 1988 by Soft Warehouse Inc, Derive provides a graphical user interface for performing various mathematical calculations and analysis.With Derive, users can perform symbolic and numeric calculations, plot 2D...
Derive image
SaiCalculator icon

SaiCalculator

SaiCalculator is a free calculator app designed specifically for mobile devices. With its clean and intuitive interface, it aims to provide an enjoyable calculation experience for casual and power users alike.At its core, SaiCalculator offers all the basic arithmetic functions you would expect - addition, subtraction, multiplication, division - while...
SaiCalculator image
Python(x,y) icon

Python(x,y)

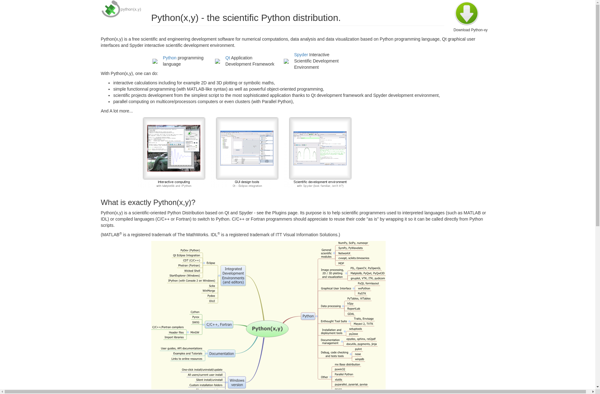
python(x,y) is an open-source mathematical plotting and data visualization library for the Python programming language. It is designed to be simple, efficient, and highly customizable. python(x,y) provides a MATLAB-like interface for creating a wide range of 2D plots, including line plots, scatter plots, histograms, bar charts, pie charts, error bars,...
Python(x,y) image
Grapher icon

Grapher

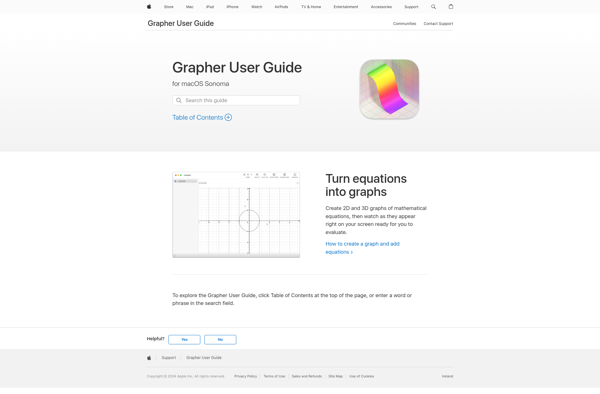
Grapher is a powerful 2D and 3D graphing utility developed by Apple Inc. and included with macOS. It allows users to visualize a wide variety of data sets, equations, geometric shapes, scalar/vector fields in 2D and 3D, and more. Some key features of Grapher include:Intuitive interface for entering equations and...
Grapher image
Data Analysis Tool icon

Data Analysis Tool

The data analysis tool is a powerful software for examining and making sense of all kinds of data. It provides a user-friendly graphical interface that allows anyone, from business analysts to data scientists, to easily visualize data, uncover patterns and trends, and generate valuable insights.Key features include:Interactive drag-and-drop interface for...
Data Analysis Tool image
SciDaVis icon

SciDaVis

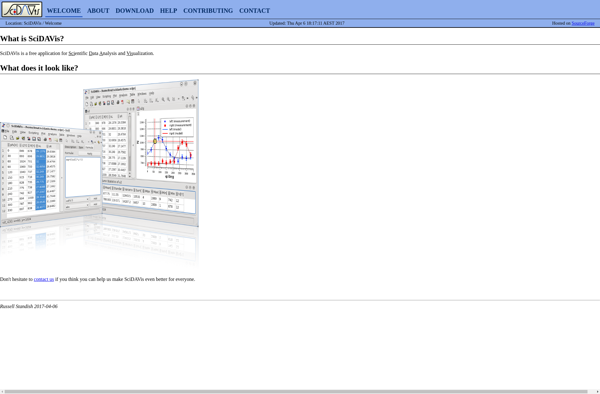
SciDaVis is a cross-platform computer program for numerical analysis and data visualization. It is designed to be compatible with OriginLab Origin software in terms of analysis capabilities and interface, while being free and open-source.Some key features of SciDaVis include:Interactive 2D and 3D plotting from imported dataA wide variety of 2D...
SciDaVis image
Golden Software Grapher icon

Golden Software Grapher

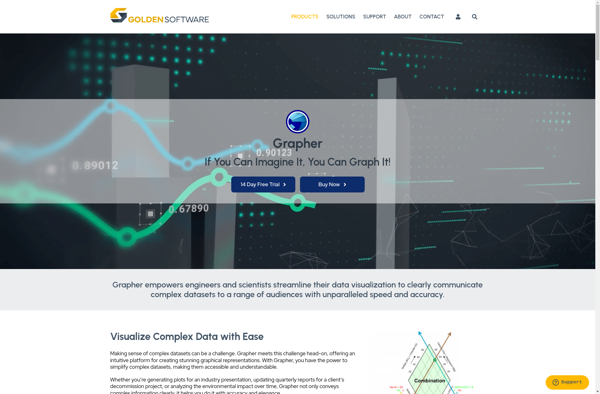
Golden Software Grapher is a powerful 2D and 3D scientific data visualization application. It enables users to create a wide variety of graphs and charts to represent complex data sets, including specialized plots like contour, vector, watershed, pie, bar, scatter, polar, ternary, statistical graphs and many more.Grapher excels at handling...
Golden Software Grapher image
DPlot icon

DPlot

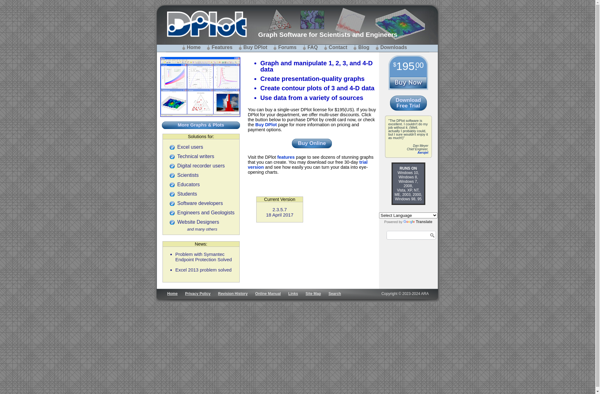
DPlot is an open-source, cross-platform application designed for interactive scientific data visualization and analysis. It features a user-friendly graphical interface that allows users to easily create 2D and 3D plots, fit data to both linear and non-linear models, perform statistical analysis, and customize graph attributes.Some key features of DPlot include:Support...
DPlot image
WordMat icon

WordMat

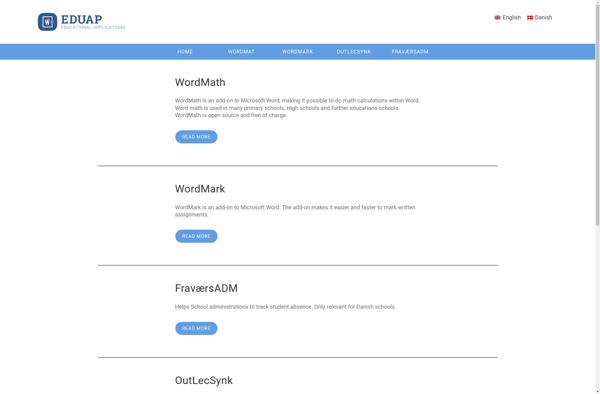
WordMat is a free and open-source word processor application for Windows, macOS, and Linux operating systems. It provides basic yet powerful word processing capabilities for creating professional documents, reports, letters, and more.Some of the key features of WordMat include:Intuitive and easy-to-use WYSIWYG interfaceSupports common document formatting options - fonts, colors,...
WordMat image
FxSolver icon

FxSolver

fxSolver is a free online math calculator and equation solver. It allows users to easily solve a wide range of math problems and calculate formulas without needing to install any software.Some key features of fxSolver include:Supports various common math functions like trigonometry, logarithms, fractions, matrices, etc.Can solve equations and formulas...
FxSolver image
Aveloy Graph icon

Aveloy Graph

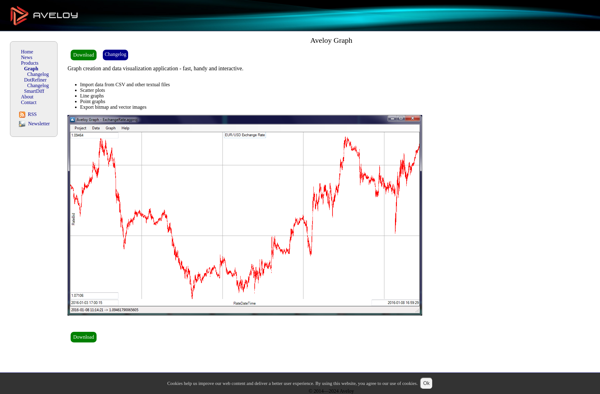
Aveloy Graph is a no-code business intelligence analytics and visualization software for building interactive dashboards. It provides an intuitive way for users of all skill levels to visualize data and create shareable analytics.With Aveloy Graph, users can connect data from multiple sources including MySQL, PostgreSQL, MongoDB, Excel, CSV files, and...
Aveloy Graph image
KSEG icon

KSEG

KSEG is an open-source software that serves as both a waveform generator and oscilloscope for Linux systems. It provides a user-friendly graphical interface that allows users to easily generate various waveforms including sine, square, triangle, sawtooth, as well as arbitrary/user defined waveforms. Some key features of KSEG include:Generate waveforms with...
KSEG image
Matplotlib icon

Matplotlib

Matplotlib is a comprehensive 2D plotting library for Python that enables users to create a wide variety of publication-quality graphs, charts, and visualizations. It supports many basic and advanced plotting functionalities and integrates well with NumPy and Pandas data structures.Matplotlib can be used to visualize data in a variety of...
Matplotlib image
Giac/Xcas icon

Giac/Xcas

Giac/Xcas is a powerful, open-source computer algebra system (CAS) used for symbolic computation in mathematics, science, and engineering. It offers capabilities for symbolic calculations, solving equations, simplifying algebraic expressions, differentiation and integration, 2D/3D plotting, statistics, and more.Some key features and capabilities of Giac/Xcas include:Symbolic manipulation of mathematical expressions and formulasNumerical...
Giac/Xcas image
Lybniz icon

Lybniz

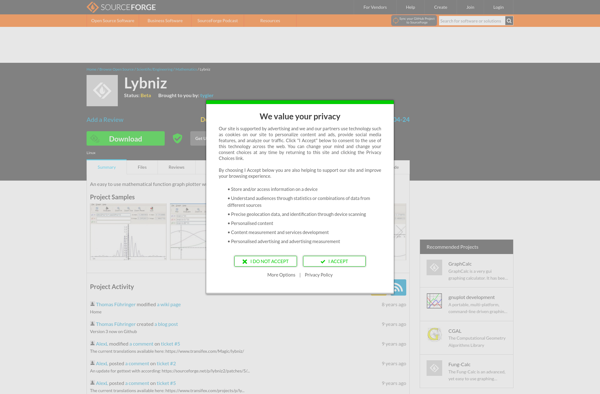
Lybniz is a free, open-source graphing calculator software for Windows, Linux and macOS operating systems. It provides an intuitive graphical user interface for drawing mathematical equations, functions and graphs on screen. As equations are typed or drawn with the mouse, Lybniz dynamically plots the corresponding graph, allowing for visualization and...
Lybniz image
CaRMetal icon

CaRMetal

CaRMetal is an open-source, physically-based renderer focused on high-quality automotive visualization and aimed at applications like online configurators, virtual showrooms, augmented reality, and more.It utilizes Apple's Metal graphics framework, running on both macOS and iOS platforms. Key features include:Physically-based rendering of car paints, interiors, lights, and environment mapsHigh-quality rendering of...
CaRMetal image
Ludigraphix icon

Ludigraphix

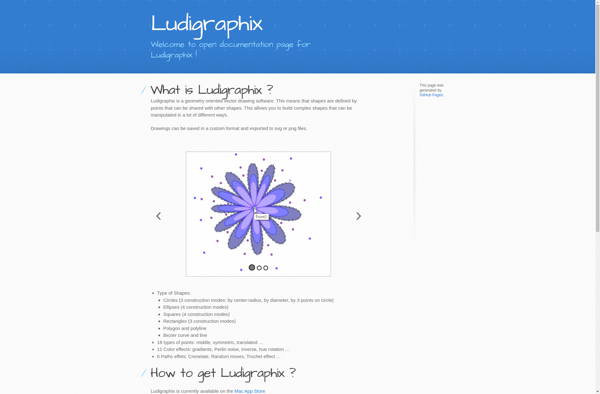
Ludigraphix is an open-source, cross-platform 2D graphics editor for game developers, graphic designers, and artists. It is designed to create, edit, and manage sprite sheets, tilesets, textures, and other graphics for video games or digital art.Some key features of Ludigraphix include:Intuitive user interface with tools like pencil, rectangle, circle, line,...
Ludigraphix image
Autograph icon

Autograph

Autograph is software designed specifically for applying digital signatures to documents. It allows individuals and teams to sign PDFs, Word documents, and other file types electronically.Some key features of Autograph include:Intuitive drag-and-drop interface for adding signatures to PDFsRole-based signing workflows with sequential or parallel routing optionsBulk sending of documents for...
Autograph image
Sequalator icon

Sequalator

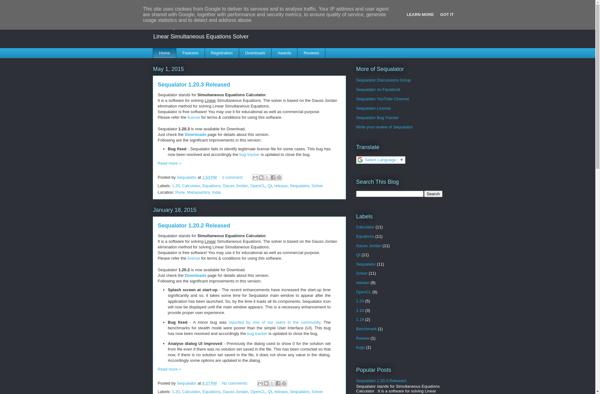
Sequalator is an open source database change management and migration tool designed specifically for MySQL, MariaDB, and Percona databases. It enables developers, DBAs, and DevOps engineers to easily version, deploy, and rollback schema changes and reference data migrations.With an intuitive user interface, access control, automation capabilities, and migration validation checks,...
Sequalator image
GrafEq icon

GrafEq

GrafEq is an open-source, cross-platform math equation editor and graphing calculator software. It is designed to help students, teachers, scientists, and engineers visualize and analyze mathematical functions and data.Key features of GrafEq include:Intuitive equation editor for writing math expressions with standard LaTeX math syntax2D and 3D function graphing with control...
Desmos Geometry Calculator icon

Desmos Geometry Calculator

Desmos is a free online graphing calculator and geometry tool used by millions of students and teachers around the world. It allows users to graph functions, plot data, animate sliders, and explore math visually. Some of the key features of Desmos include:Intuitive graphing calculator interface for plotting functions, inequalities, parametric...
Desmos Geometry Calculator image
Core Plot icon

Core Plot

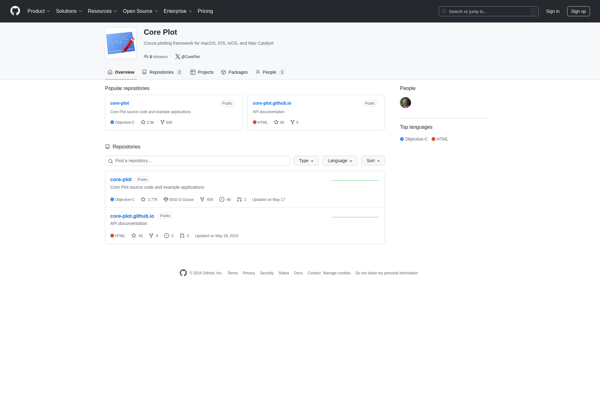
Core Plot is an open-source, 2D plotting framework for macOS, iOS, and tvOS applications. It enables developers to easily create high-performance, publication-quality graphs and charts for inclusion in native Mac, iPhone, iPad, and Apple TV apps.Some key capabilities and benefits of Core Plot include:High-performance rendering, with full support for large...
Core Plot image
CODAP icon

CODAP

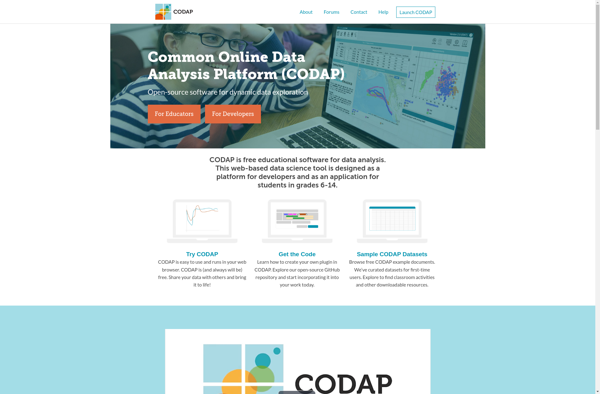
CODAP (Common Online Data Analysis Platform) is a free, interactive, web-based data exploration, analysis, and visualization tool designed specifically for use in education. It enables students in grades 6-14 to analyze authentic, real-world data in an engaging, accessible way to support computational thinking, quantitative reasoning, and conceptual understanding across various...
CODAP image
Apollonius icon

Apollonius

Apollonius is an open-source diagramming and vector graphics editor for Windows, macOS and Linux operating systems. It provides a streamlined user interface and tools for creating diagrams, flowcharts, UML models, network topology maps, floor plans and other vector graphics.Key features of Apollonius include:Intuitive drag-and-drop interface for quickly drafting diagramsComprehensive set...
Apollonius image