Grapher
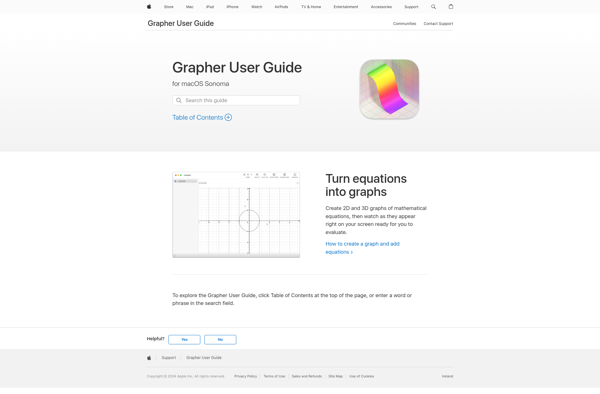
Grapher is a 2D and 3D graphing utility for macOS that allows users to visualize data sets, equations, geometric shapes, and more. It includes features for customizing graph appearance, adding text annotations, animations, exporting images, and mathematical calculations.
Grapher: 2D & 3D Graphing Utility
Visualize data sets, equations, shapes, and more with customizable graph appearance, text annotations, animations, image export, and mathematical calculations.
What is Grapher?
Grapher is a powerful 2D and 3D graphing utility developed by Apple Inc. and included with macOS. It allows users to visualize a wide variety of data sets, equations, geometric shapes, scalar/vector fields in 2D and 3D, and more. Some key features of Grapher include:
- Intuitive interface for entering equations and data sets
- Extensive customization options for controlling axis ranges, graph styles, colors, text labels, and more
- 2D and 3D visualization with options like rotation, lighting, animation
- Support for various graph types - line, scatter, bar, pie, histograms, etc.
- Layering of multiple graphs and equations on a single coordinate plane
- Annotation tools for adding text, arrows, geometric shapes to graphs
- Mathematical calculations like derivatives, integrals, FFTs, interpolation
- Image export in PNG, JPEG, TIFF, PDF formats
- Graph merging and synchronization between multiple windows
- AppleScript support for automating workflows
- Clean, native macOS interface
With itsattention to detail and polish in design, Grapher provides a capable, accessible tool for students, engineers, mathematicians and other professionals to analyze data and visualize mathematical concepts on Apple's macOS platform.
Grapher Features
Features
- 2D and 3D graphing
- Customizable graph appearance
- Adding text annotations
- Animations
- Image exporting
- Mathematical calculations
Pricing
- One-time Purchase
Pros
User-friendly interface
Powerful graphing capabilities
Supports many graph types
Good for visualizing data
Integrates with other macOS apps
Cons
Limited to macOS platform
Can be slow with large datasets
Lacks some advanced features of similar software
Reviews & Ratings
Login to ReviewThe Best Grapher Alternatives
Top Science & Education and Mathematics & Data Visualization and other similar apps like Grapher
Here are some alternatives to Grapher:
Suggest an alternative ❐Mathematica
Mathematica is a computational software program developed by Wolfram Research. It is used for symbolic and numerical mathematics, data visualization, image processing, and a wide range of technical computing applications.Some key features of Mathematica include:A symbolic algebra engine that can manipulate mathematical expressions, solve equations, simplify expressions, compute derivatives and...
Wolfram Alpha
Wolfram Alpha is an online service that provides detailed expert-level answers to plain language questions on a wide variety of topics including mathematics, science, technology, culture, geography, linguistics, sports, and more. It was created by Stephen Wolfram and his company Wolfram Research.Wolfram Alpha differs from standard search engines because it...
GeoGebra
GeoGebra is a free, open-source dynamic mathematics software that can be used for teaching and learning mathematics at all levels of education. It combines geometry, algebra, spreadsheets, graphing, statistics and calculus in one easy-to-use and well-integrated package making it an excellent tool for demonstrating mathematical concepts.Some of the key features...

Desmos
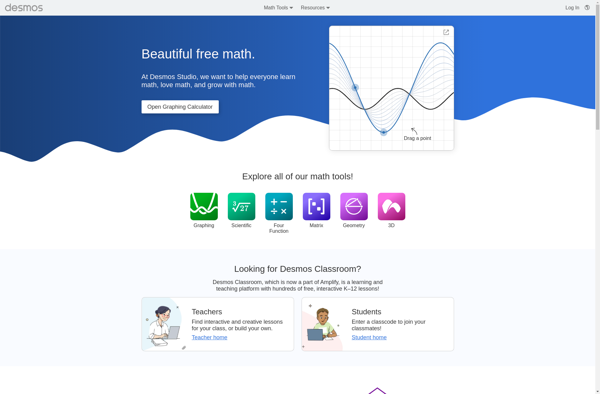
Desmos is an online graphing calculator and geometry tool used by students, teachers, and professionals in math, science, engineering, business, and more. It allows users to quickly visualize mathematical functions, equations, inequalities, and data sets with an easy-to-use web interface and mobile apps for iOS and Android.Key features of Desmos...
Google Calculator
Google Calculator is a free web-based calculator offered by Google. It provides standard, scientific, and programmer calculator functionality for fast mathematical calculations and unit conversions right in your web browser.Some key features of Google Calculator include:Perform basic arithmetic like addition, subtraction, multiplication, and divisionDo scientific calculations such as trigonometric, logarithmic,...

GnuPlot
GnuPlot is a powerful, stable and free scientific graphing package with advanced capabilities. Developed originally for Unix-like operating systems, GnuPlot is now available for Windows, macOS and Linux.It can produce high-quality graphical visualizations of data from files or stdin, including simple x-y plots, histograms, contour plots, mesh plots, polar plots,...

Python(x,y)
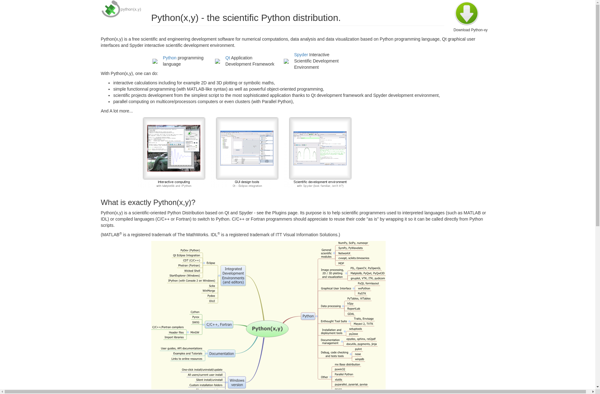
python(x,y) is an open-source mathematical plotting and data visualization library for the Python programming language. It is designed to be simple, efficient, and highly customizable. python(x,y) provides a MATLAB-like interface for creating a wide range of 2D plots, including line plots, scatter plots, histograms, bar charts, pie charts, error bars,...
Graph Toy
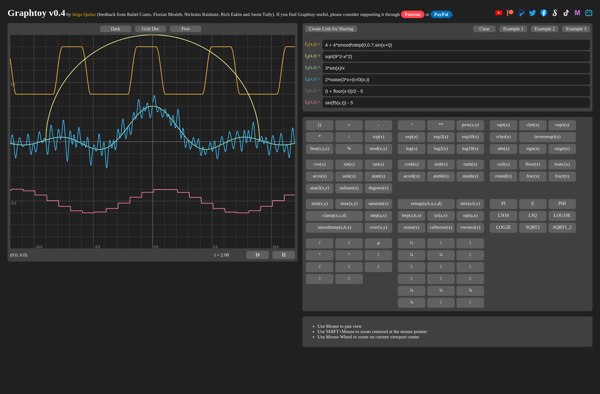
Graph Toy is a free online graphing calculator and visualization tool used by students, teachers, and mathematics enthusiasts. It allows users to visually explore and understand mathematical functions by plotting them on a graph.Some key features of Graph Toy include:Intuitive drag-and-drop interface to add/remove and manipulate graphsSupports various function types...
Graphtoy
Graphtoy is a free, open-source data visualization application designed to allow anyone to quickly create interactive charts, graphs, and data stories without coding. It features an intuitive drag-and-drop interface that makes data visualization accessible to everyone.Some key features and capabilities of Graphtoy include:Import data from CSV files, spreadsheets, databases, and...
PCalc
PCalc is a powerful and full-featured calculator app developed by James Thomson originally for iOS and later brought to macOS. It goes far beyond the basic calculator app provided by Apple, offering a wide range of mathematical and conversion capabilities.Key features of PCalc include:Supports basic and scientific calculator modes with...

Golden Software Grapher
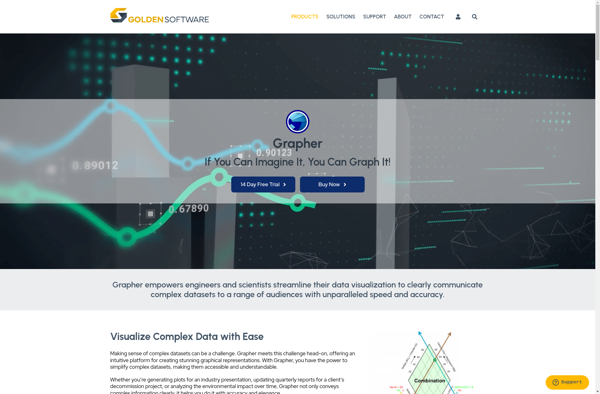
Golden Software Grapher is a powerful 2D and 3D scientific data visualization application. It enables users to create a wide variety of graphs and charts to represent complex data sets, including specialized plots like contour, vector, watershed, pie, bar, scatter, polar, ternary, statistical graphs and many more.Grapher excels at handling...
FxSolver
fxSolver is a free online math calculator and equation solver. It allows users to easily solve a wide range of math problems and calculate formulas without needing to install any software.Some key features of fxSolver include:Supports various common math functions like trigonometry, logarithms, fractions, matrices, etc.Can solve equations and formulas...

Graphmatica
Graphmatica is a powerful, user-friendly software application for visualizing and analyzing complex network graphs. Developed by an international team of researchers and programmers, Graphmatica is offered completely free of charge under an open-source license.With an intuitive graphical interface, Graphmatica makes it easy to import network data from standard file formats...

NumWorks Graphing Calculator
The NumWorks Graphing Calculator is an advanced programmable graphing calculator developed in France by a startup company called NumWorks. It was first released in 2017 as an alternative to popular calculators like the TI-84 Plus or Casio fx-CG50.The NumWorks stands out for its large, high-resolution screen that allows sharp and...

Matplotlib
Matplotlib is a comprehensive 2D plotting library for Python that enables users to create a wide variety of publication-quality graphs, charts, and visualizations. It supports many basic and advanced plotting functionalities and integrates well with NumPy and Pandas data structures.Matplotlib can be used to visualize data in a variety of...

GeoGebra Graphing Calculator
GeoGebra is a free, multi-platform mathematics software that allows users to utilize geometry, algebra, spreadsheets, graphing, statistics and calculus in a single, user-friendly application. First released in 2002 by founder Markus Hohenwarter as part of his master's thesis, GeoGebra aims to provide high school and college students with an interactive...
Lybniz
Lybniz is a free, open-source graphing calculator software for Windows, Linux and macOS operating systems. It provides an intuitive graphical user interface for drawing mathematical equations, functions and graphs on screen. As equations are typed or drawn with the mouse, Lybniz dynamically plots the corresponding graph, allowing for visualization and...
GeoGebra CAS Calculator
GeoGebra is a free, multi-platform dynamic mathematics software that joins geometry, algebra, tables, graphing, statistics and calculus in one easy-to-use package. It can be used for all levels of mathematics education from elementary through university level. Some of the key features of GeoGebra include:Graphing functions, inequalities, conic sectionsDynamic geometric constructions,...
GrafEq
GrafEq is an open-source, cross-platform math equation editor and graphing calculator software. It is designed to help students, teachers, scientists, and engineers visualize and analyze mathematical functions and data.Key features of GrafEq include:Intuitive equation editor for writing math expressions with standard LaTeX math syntax2D and 3D function graphing with control...

Core Plot
Core Plot is an open-source, 2D plotting framework for macOS, iOS, and tvOS applications. It enables developers to easily create high-performance, publication-quality graphs and charts for inclusion in native Mac, iPhone, iPad, and Apple TV apps.Some key capabilities and benefits of Core Plot include:High-performance rendering, with full support for large...
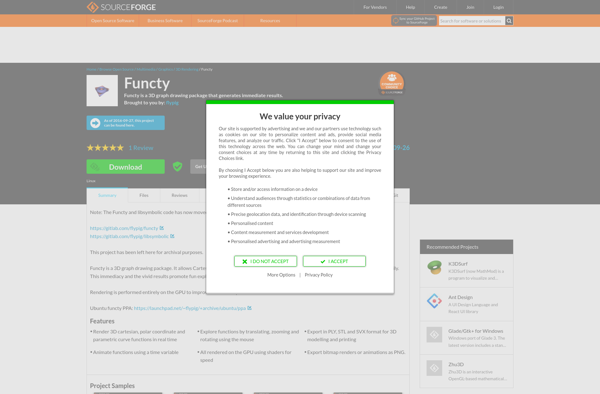
Functy
Functy is a powerful yet easy-to-use automation platform designed for workflow automation and integration. With its intuitive drag-and-drop interface, anyone can automate repetitive tasks and connect various apps and services without writing any code.Some key features of Functy include:Visually build workflows by connecting app building blocks300+ pre-built integrations with various...
