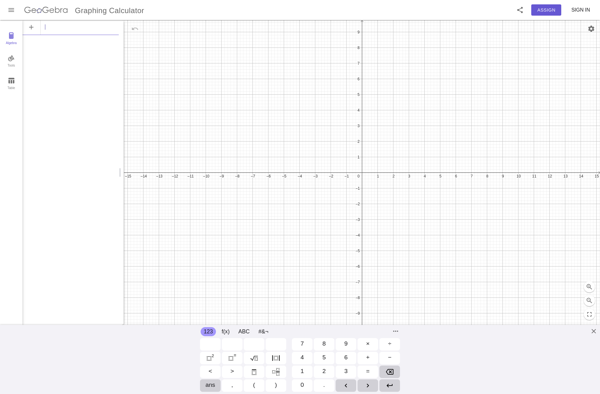
GeoGebra is a free open-source dynamic mathematics software for all levels of education. It combines geometry, algebra, tables, graphing, statistics and calculus in one easy-to-use package. It can be used for graphing equations and functions, exploring geometry, providing dynamic
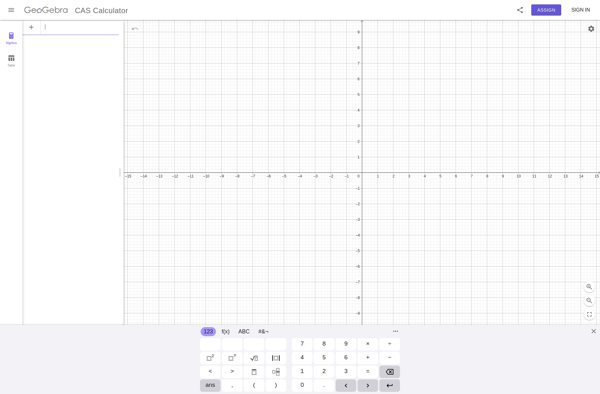
GeoGebra CAS Calculator: Free Open-Source Math Software
GeoGebra is a free open-source dynamic mathematics software for all levels of education. It combines geometry, algebra, tables, graphing, statistics and calculus in one easy-to-use package. It can be used for graphing equations and functions, exploring geometry, providing dynamic representations of mathematical concepts, developing student worksheets, and assessments.
What is GeoGebra CAS Calculator?
GeoGebra is a free, multi-platform dynamic mathematics software that joins geometry, algebra, tables, graphing, statistics and calculus in one easy-to-use package. It can be used for all levels of mathematics education from elementary through university level.
Some of the key features of GeoGebra include:
Graphing functions, inequalities, conic sections
Dynamic geometric constructions, with options for angles, lengths, areas, circles and more
CAS (Computer Algebra System) feature for symbolic calculations
Spreadsheet view for tables and data, with cell formulas
Probability calculator and statistics features
3D graphing
Exporting animations, images and presentations
Available on all platforms - Windows, Mac, Linux, tablets and web browsers
Extensive materials library and lesson plans for classroom use
Supports over 55 languages
GeoGebra provides a flexible tool for mathematical exploration and visualization at all levels. Its clean interface and ease of use makes GeoGebra an engaging way for students to interact with math concepts and teachers to provide dynamic representations in the classroom or through remote learning.
OriginPro is a powerful data analysis and graphing software designed for scientists, engineers, and analysts across various industries. It is developed by OriginLab Corporation for analyzing, graphing, and presenting scientific data.Some of the key features of OriginPro include:An extensive selection of analysis tools like peak analysis, surface fitting, statistics, signal...
GnuPlot is a powerful, stable and free scientific graphing package with advanced capabilities. Developed originally for Unix-like operating systems, GnuPlot is now available for Windows, macOS and Linux.It can produce high-quality graphical visualizations of data from files or stdin, including simple x-y plots, histograms, contour plots, mesh plots, polar plots,...
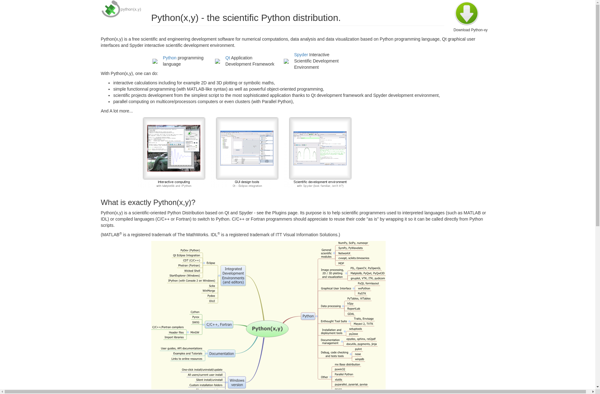
python(x,y) is an open-source mathematical plotting and data visualization library for the Python programming language. It is designed to be simple, efficient, and highly customizable. python(x,y) provides a MATLAB-like interface for creating a wide range of 2D plots, including line plots, scatter plots, histograms, bar charts, pie charts, error bars,...
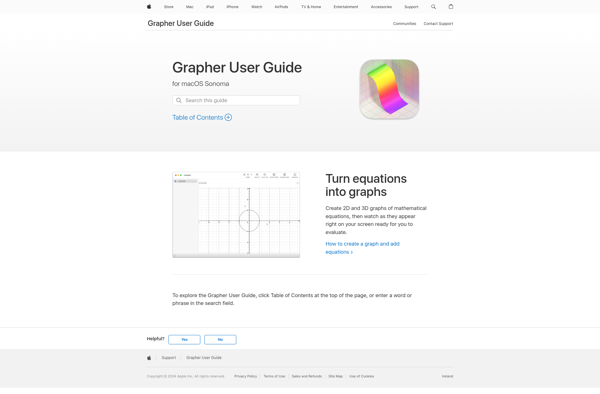
Grapher is a powerful 2D and 3D graphing utility developed by Apple Inc. and included with macOS. It allows users to visualize a wide variety of data sets, equations, geometric shapes, scalar/vector fields in 2D and 3D, and more. Some key features of Grapher include:Intuitive interface for entering equations and...
SciDaVis is a cross-platform computer program for numerical analysis and data visualization. It is designed to be compatible with OriginLab Origin software in terms of analysis capabilities and interface, while being free and open-source.Some key features of SciDaVis include:Interactive 2D and 3D plotting from imported dataA wide variety of 2D...
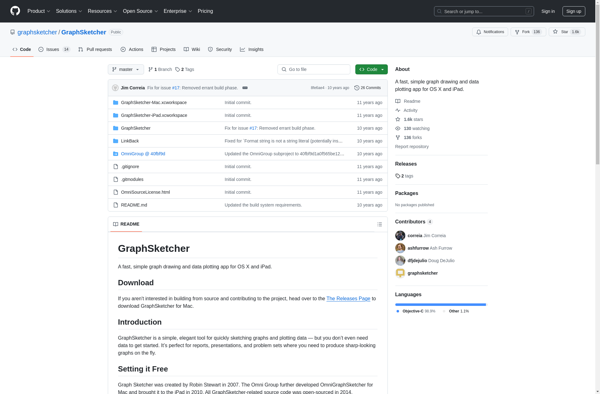
GraphSketcher is a powerful yet easy-to-use diagramming and graphing software. As an open-source application, GraphSketcher is completely free to download and use. It runs on Windows, Mac, and Linux operating systems.With an intuitive drag-and-drop interface, GraphSketcher makes it simple for users to create a wide range of diagrams and charts....
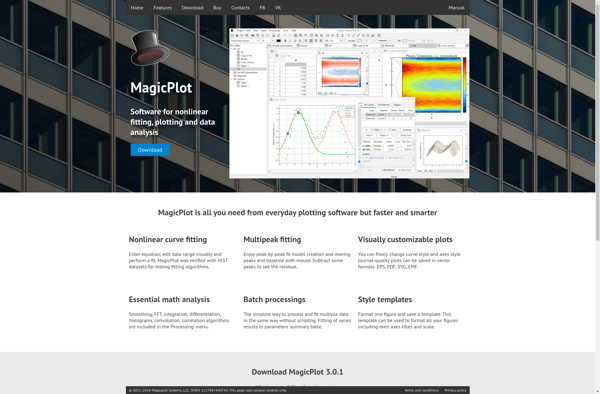
MagicPlot is a versatile software tool designed for scientific data analysis and publication-quality visualization. It runs on Windows, macOS, and Linux.With MagicPlot, users can import data from files or external sources, manipulate and analyze it, and create a wide variety of 2D and 3D graphs and charts. Its key features...
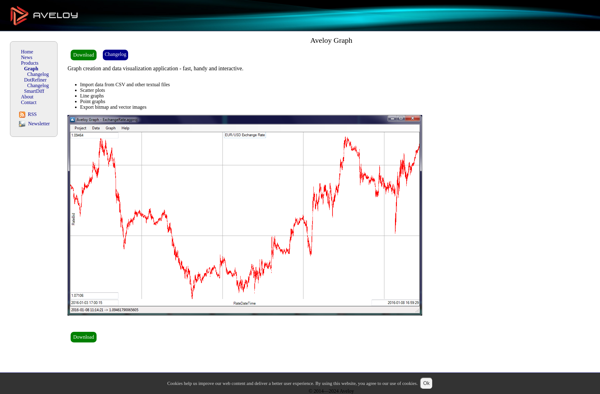
Aveloy Graph is a no-code business intelligence analytics and visualization software for building interactive dashboards. It provides an intuitive way for users of all skill levels to visualize data and create shareable analytics.With Aveloy Graph, users can connect data from multiple sources including MySQL, PostgreSQL, MongoDB, Excel, CSV files, and...
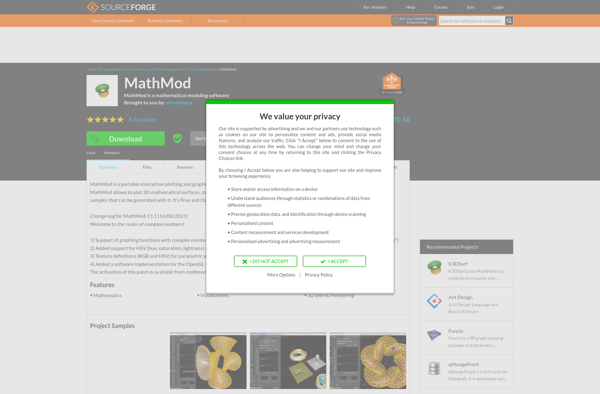
MathMod is an open-source software application designed specifically for mathematical modeling tasks. With its intuitive graphical user interface, MathMod makes it easy for students, teachers, and researchers to build, analyze, and visualize mathematical models without needing to know programming or advanced mathematics.Some key features of MathMod include:Drag-and-drop model building with...
KSEG is an open-source software that serves as both a waveform generator and oscilloscope for Linux systems. It provides a user-friendly graphical interface that allows users to easily generate various waveforms including sine, square, triangle, sawtooth, as well as arbitrary/user defined waveforms. Some key features of KSEG include:Generate waveforms with...
Matplotlib is a comprehensive 2D plotting library for Python that enables users to create a wide variety of publication-quality graphs, charts, and visualizations. It supports many basic and advanced plotting functionalities and integrates well with NumPy and Pandas data structures.Matplotlib can be used to visualize data in a variety of...
GeoGebra is a free, multi-platform mathematics software that allows users to utilize geometry, algebra, spreadsheets, graphing, statistics and calculus in a single, user-friendly application. First released in 2002 by founder Markus Hohenwarter as part of his master's thesis, GeoGebra aims to provide high school and college students with an interactive...
Lybniz is a free, open-source graphing calculator software for Windows, Linux and macOS operating systems. It provides an intuitive graphical user interface for drawing mathematical equations, functions and graphs on screen. As equations are typed or drawn with the mouse, Lybniz dynamically plots the corresponding graph, allowing for visualization and...
Autograph is software designed specifically for applying digital signatures to documents. It allows individuals and teams to sign PDFs, Word documents, and other file types electronically.Some key features of Autograph include:Intuitive drag-and-drop interface for adding signatures to PDFsRole-based signing workflows with sequential or parallel routing optionsBulk sending of documents for...
MagicPlot Viewer is a free standalone application developed by MagicPlot Inc. to view MagicPlot project files (.mpprj) without needing a full MagicPlot license. It provides core visualization and analysis capabilities to open existing plots, charts, equations and fitted data created with the MagicPlot software.Key features of MagicPlot Viewer include:Opens MagicPlot...
Functy is a powerful yet easy-to-use automation platform designed for workflow automation and integration. With its intuitive drag-and-drop interface, anyone can automate repetitive tasks and connect various apps and services without writing any code.Some key features of Functy include:Visually build workflows by connecting app building blocks300+ pre-built integrations with various...
Apollonius is an open-source diagramming and vector graphics editor for Windows, macOS and Linux operating systems. It provides a streamlined user interface and tools for creating diagrams, flowcharts, UML models, network topology maps, floor plans and other vector graphics.Key features of Apollonius include:Intuitive drag-and-drop interface for quickly drafting diagramsComprehensive set...